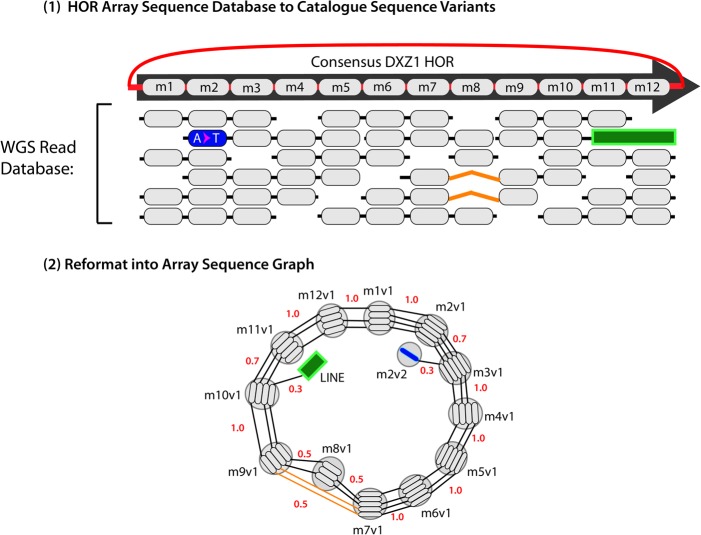
Figure 5.
A schematic example of an “Array Sequence Graph” of the type used to construct a linearization of the DXZ1 repeat array in the X Chromosome centromere (Miga et al. 2014). A collection of reads (top) shown in the context of a consensus higher-order repeat are converted into a graph representation (bottom). A cycle around the graph represents a higher-order repeat, and the individual repeat units (oblongs) are represented within each node (circles). Edges between individual repeat units represent phasing information from input reads. Transitions between nodes are annotated with probabilities. (Adapted from Miga et al. 2014, with permission from the author.)

