Figure 3.
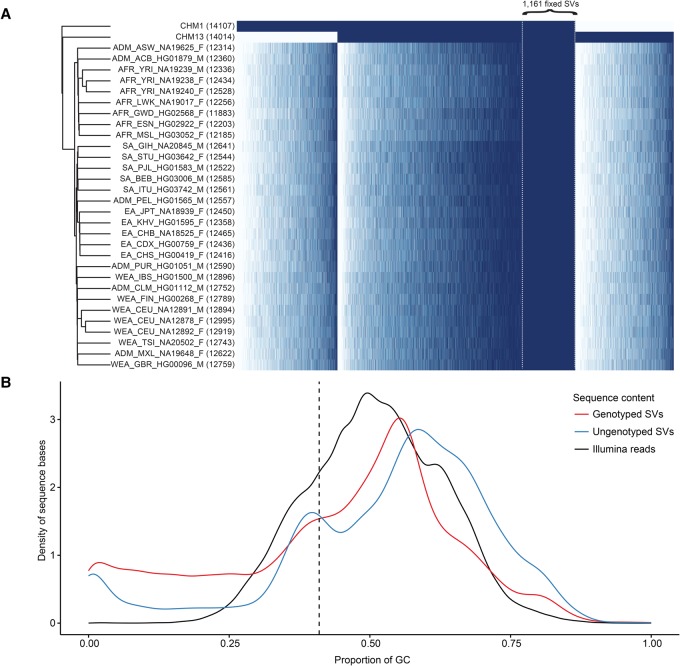
SMRT-SV genotyping with Illumina sequence data. (A) The heatmap depicts genotypes for 18,211 of 29,992 (61%) nonredundant CHM1 and CHM13 SVs that could be concordantly genotyped in both moles by their respective Illumina WGS. Each row is a sample (two moles and 30 PCR-free samples from the 1000 Genomes Project), each column is an SV, and each cell is colored by genotype: homozygous alternate (dark blue), heterozygous (light blue), and homozygous reference (white). The number of heterozygous and homozygous alternate genotypes for each sample is indicated (parentheses). Columns are ordered by presence/absence of the SV in CHM1, CHM1/CHM13, and CHM13 and then by allele count and genomic coordinate. Specifically highlighted are 1161 SVs present in both CHM1/CHM13 and fixed (homozygous alternate) in all 30 diploid human genomes, suggesting minor alleles or sequencing errors in GRCh38. (B) The density plot compares the GC composition (x-axis) of CHM1 and CHM13 SVs that could be successfully genotyped by their respective PCR-free Illumina WGS data (77%) versus those that could not. Density plots do not represent relative proportion between the two SV categories. SVs that failed to genotype were particularly biased for GC-rich regions of the genome.

