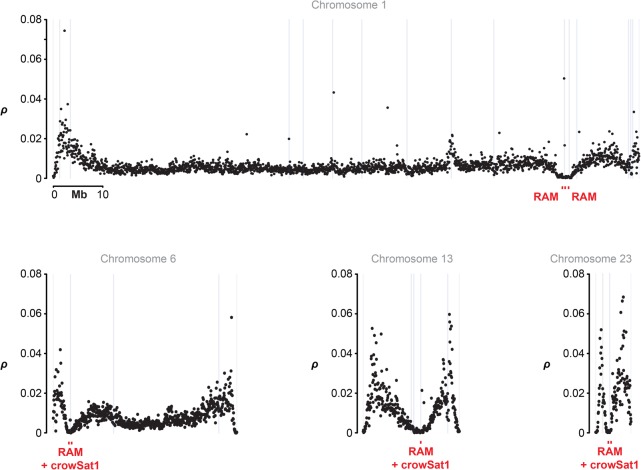
Figure 3.
Chromosome-level distribution of population-scaled recombination rate ρ and structural genome features show, for example, chromosomes of varying size: (Black dots) the weighted mean of ρ/bp in 50-kb windows estimated from a Swedish hooded crow population; (gray lines) SR scaffold ends; (red squares) repetitive anchored map (RAM) with the possible co-occurrence of the crowSat1 satellite. Data are shown for representative synteny- and collinearity-based chromosomes (for the remaining chromosomes, see Supplemental Fig. S5).

