Figure 4.
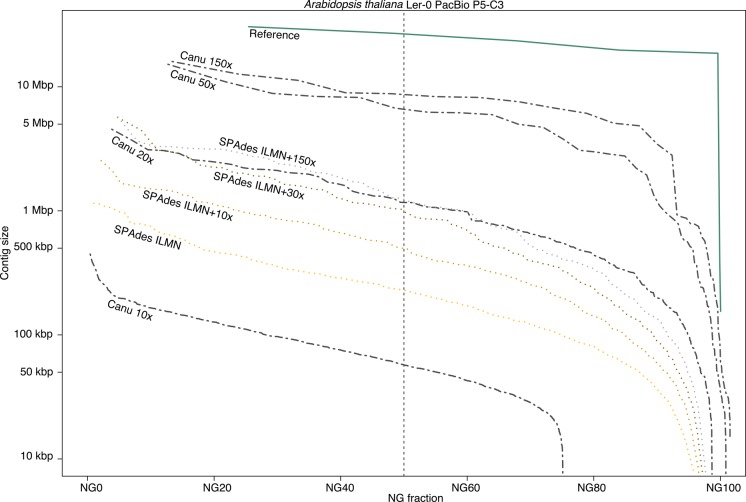
A comparison of Arabidopsis thaliana assembly continuity for Canu and SPAdes. Each set of contigs is sorted from longest to shortest and plotted versus a cumulative percentage of the genome covered. Assemblies with larger contigs appear in the top of the plot. The ideal assembly corresponds to the green reference line. The commonly used NG50 metric corresponds to the vertical dashed line. Canu quickly gains continuity with increasing coverage, approaching the limit with 50× PacBio on this genome. In contrast, while making a large gain from Illumina-only to 10× PacBio, SPAdes continuity plateaus by 30×, and the Canu 20× assembly is comparable to the hybrid SPAdes assembly using 150× PacBio.

