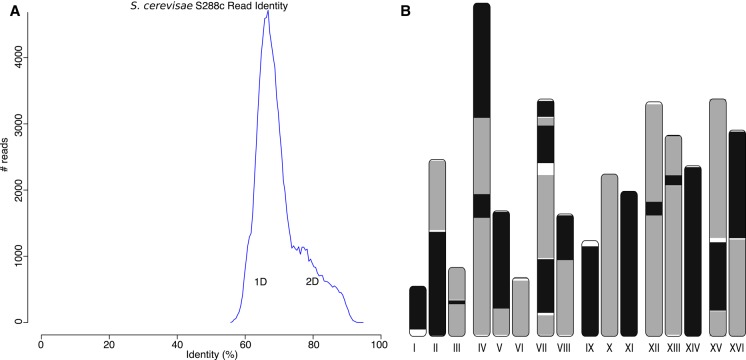
Figure 6.
A highly continuous S. cerevisae assembly from noisy 1D and 2D MinION reads. (A) A histogram of read error rates (1D and 2D) versus the reference. Alignment identity was computed only for reads with an alignment >90% of their length. The majority of reads were <75% identity with an overall average of 70%. (B) Assembled Canu contigs were aligned to the reference, and all alignments >1 kbp in length and >90% identity were then plotted using the ColoredChromosomes package (Böhringer et al. 2002). Alternating shades indicate adjacent alignments, so each transition from gray to black represents a contig boundary or alignment breakpoint. White regions indicate regions missing from the assembly. Most chromosomes are in less than three contigs, indicating structural agreement with the reference.

