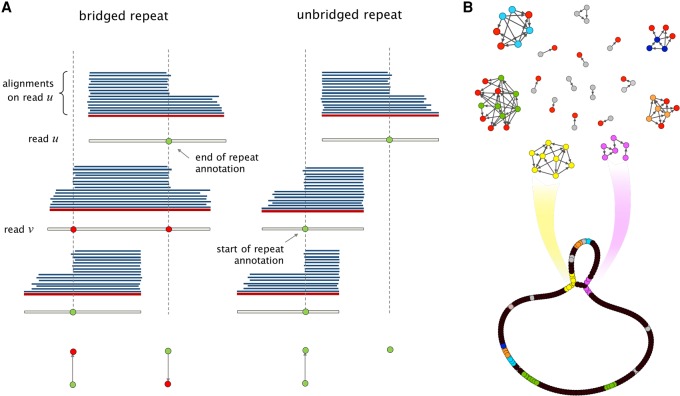
Figure 4.
(A) Sharp changes in the number of alignments give rise to repeat annotations on each read. If a read is verified to bridge a repeated, as in the case of read v, the corresponding read annotations are marked as such (shown as red nodes). (B) The Contagion graph is formed by having all repeat annotations as nodes, and using edges to mark annotations that correspond to the beginning (or end) of the same repeat. As illustrated here for NCTC11022, connected components with no bridged repeat annotations will give rise to hinged reads, which leads to bifurcations on the graph. The repeats corresponding to other connected components stay resolved in the graph.

