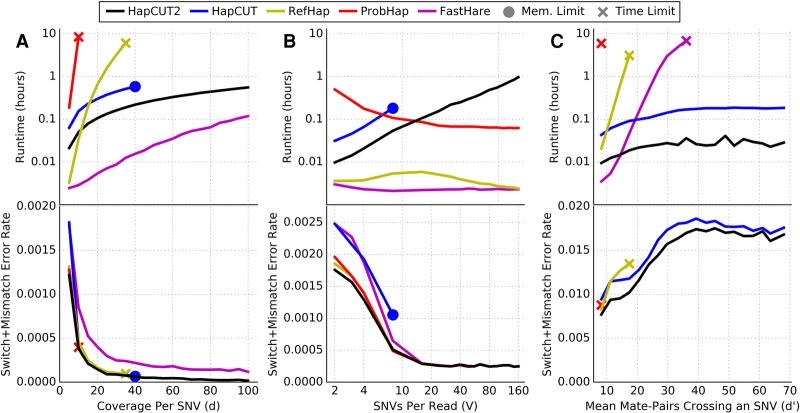
Figure 1.
Comparison of runtime (top panel) and switch + mismatch error rate (bottom panel) for HapCUT2 with four methods for haplotype assembly (HapCUT, RefHap, ProbHap, and FastHare) on simulated read data as a function of (A) mean coverage per variant (variants per read fixed at four); (B) mean variants per read (mean coverage per variant fixed at five); and (C) mean number of paired-end reads crossing a variant (mean coverage per variant fixed at five, read length 150 bp, random insert size up to a variable maximum value). Lines represent the mean of 10 replicate simulations. FastHare is not visible on C (bottom) due to significantly higher error rates.

