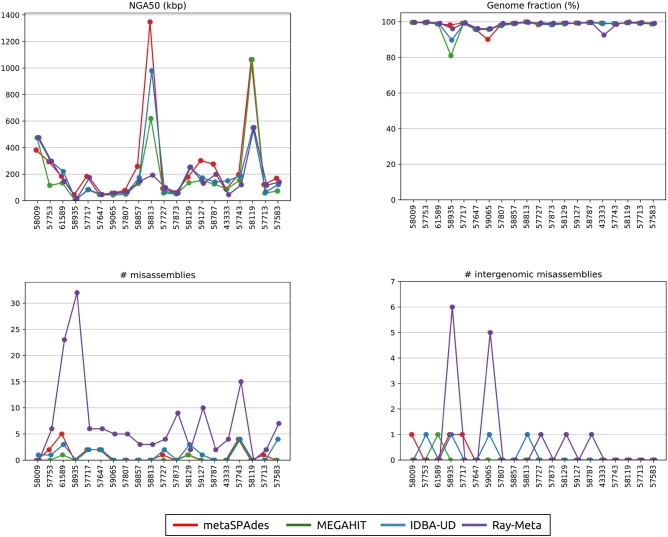
Figure 2.
metaQUAST statistics for 20 most abundant species comprising the SYNTH data set. The NGA50 statistics (top left), the fraction of the reconstructed genome compared with the total genome length (top right), the number of intragenomic misassemblies (bottom left), and the number of intergenomic misassemblies (bottom right) for 20 most abundant species comprising the SYNTH data set. References are denoted by their RefSeq IDs (see Supplemental Table S2) and arranged in the decreasing order of the coverage depths.

