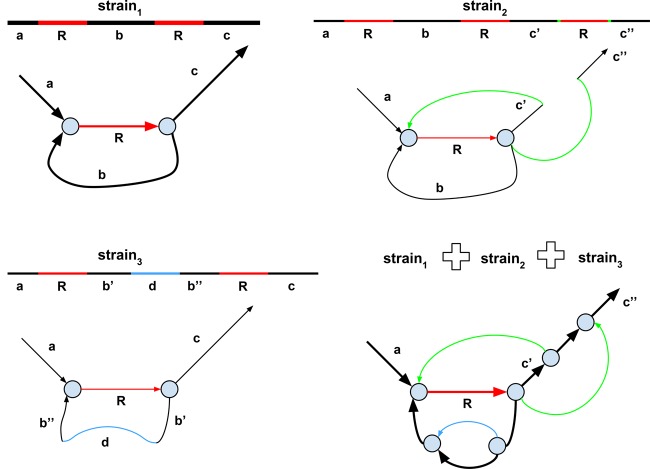
Figure 3.
The de Bruijn graphs of three strains and their strain mixture. The figure shows only a small subgraph of the de Bruijn graph. The abundant strain (strain1) is shown by thick lines, and the rare strains (strain2 and strain3) are shown by thin lines. The genomic repeat R is shown in red. (Top left) The de Bruijn graph of the abundant strain1. (Top right) The rare strain2 differs from the abundant strain1 by an insertion of an additional copy or repeat R. The two breakpoint edges resulting from this insertion are shown in green. These filigree edges are not removed by the graph simplification procedures in the standard assembly tools aimed at isolates. (Bottom left) The rare strain3 differs from the abundant strain1 by an insertion of a horizontally transferred gene (or a highly diverged genomic region). (Bottom right) The de Bruijn graph of the mixture of three strains.

