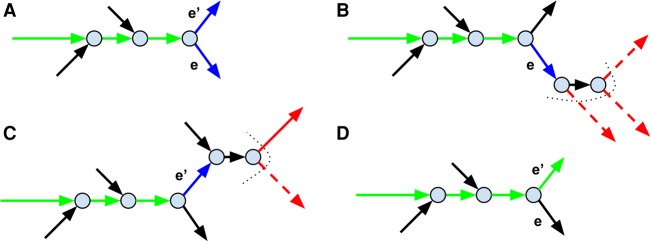
Figure 4.
Applying the metagenomics-specific decision rule for repeat resolution. The figure shows only a small subgraph of the assembly graph. (A) The path that is currently being extended (formed by green edges) along with its blue extension edges e and e′. (B) The short-edge traversal from the end of the extension edge e. The dotted curve shows the boundary frontier(e) of the traversal. The edges in the set next(e) are shown in red with low-coverage edges represented as dashed arrows (other edges in next(e) are represented as solid arrows). Since all edges in next(e) have low coverage, the edge e is ruled out as an unlikely extension candidate. (C) The short-edge traversal from the end of the extension edge e′. (D) Since e′ is a single extension edge that was not ruled out (there is a solid edge in next(e′)), it is added to the growing path and the extension process continues.

