Figure 4.
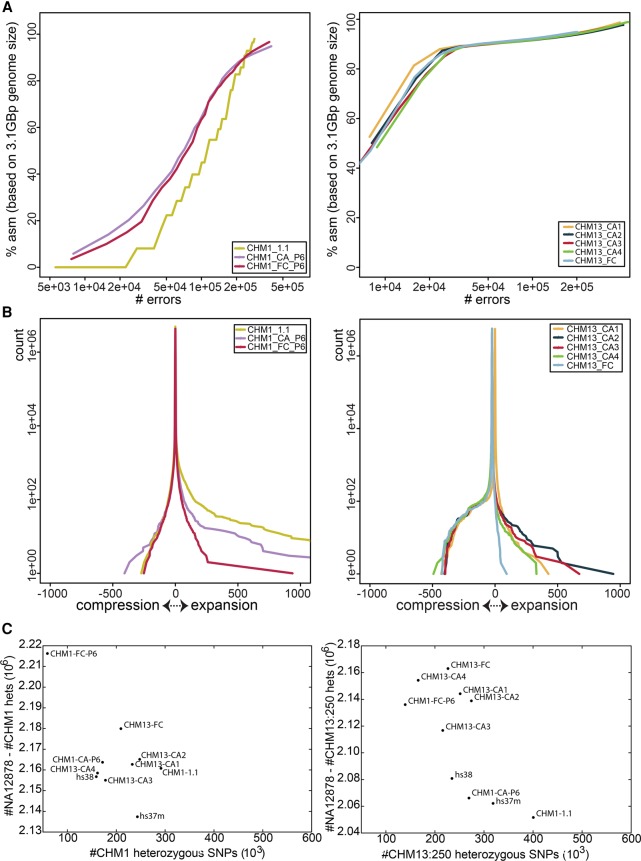
Evaluation of CHM1 and CHM13 assemblies. (A) FRC error curve for CHM1 (left) and CHM13 (right) assemblies. CHM1_1.1 is provided for comparison with the CHM1 de novo assemblies. The x-axis is log-scaled. (B) FRC compression-expansion curve for CHM1 (left) and CHM13 (right) showing the distribution of mapped reads. Divergence from the center indicates compression (negative) and expansion (positive). (C) Heterozygous SNPs called on the CHM1 and CHM13 de novo assemblies, CHM1_1.1 and GRCh38 using NA12878 and CHM1 (left) and CHM13 (right) aligned FermiKit assemblies. The x-axis represents potential false positives, and the y-axis measures potential true positives; optimal assemblies appear in the upper left of the plot.

