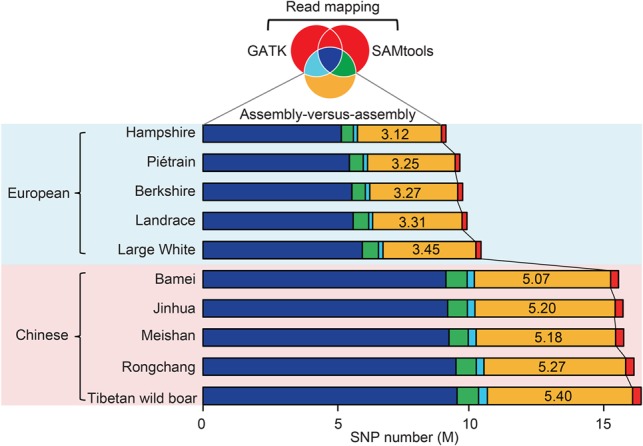
Figure 1.

Comparison of SNP calling between the assembly-versus-assembly method and resequencing approaches based on read mapping. The Venn diagram with colors corresponding to the bar chart shows the sharing of identified SNPs among the assembly-versus-assembly method and two resequencing algorithms as implemented in SAMtools and GATK. An average of 4.25 M SNPs per breed were specifically identified by the assembly-versus-assembly method (marked as yellow), while only 0.24 k SNPs per breed were categorized by resequencing approaches (marked as red). A significant fraction of the detected SNPs by SAMtools (8.11 M per individual) and GATK (7.77 M per individual) was coincident (7.41 M; or 91.24% of SAMtools and 95.34% of GATK) (Supplemental Fig. S8).
