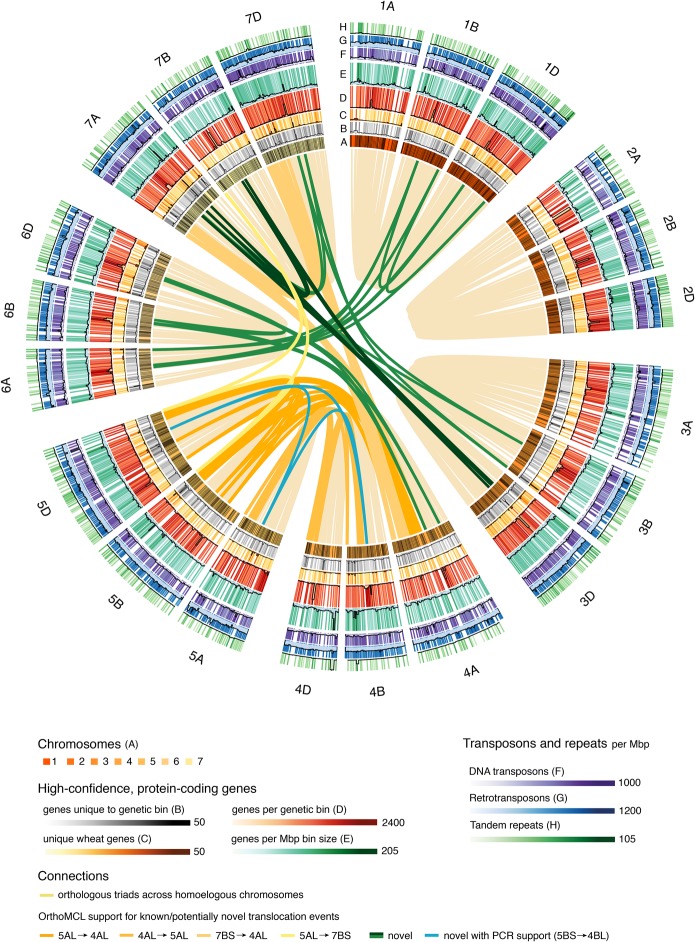
Figure 4.
Circular representation of the TGACv1 CS42 assembly. Chromosomes, genetic bins, and genomic features are visualized on the outer rings (A–H) and interchromosomal links identify known and potentially novel translocation events. (A) The seven chromosome groups of the A, B, and D genomes, scaled by number of genetic bins (black bands). (B–H) Combined heatmap/histogram representations of genomic features per genetic bin. With the exception of D, all counts are normalized by the size of the genetic bin in Mbp, calculated as the total size of all scaffolds assigned to the bin. (B) Distribution of unique genes, i.e., genes that did not have orthologs in a genome-wide OrthoMCL screen. (C) Distribution of wheat-specific genes. (D,E) Number of HC protein-coding genes. (F) Distribution of DTC, DTM, and DTH DNA transposons (Supplemental Information S1; Supplemental Table S7.1). (G) Distribution of RLX, RLC, RLG, RXX, and RIX retrotransposons. (H) Distribution of tandem duplications. Light yellow links connect homoeologous OrthoMCL triads. Dark yellow-colored links connect genetic bins harboring OrthoMCL outlier triads (Supplemental Information S1, section S6) that identify known translocation events. Dark green links connect genetic bins harboring at least three OrthoMCL outlier triads that may support novel translocation events. The cyan link shows a novel PCR-validated translocation event between Chromosomes 5BS-4BL.

