
Figure 2.
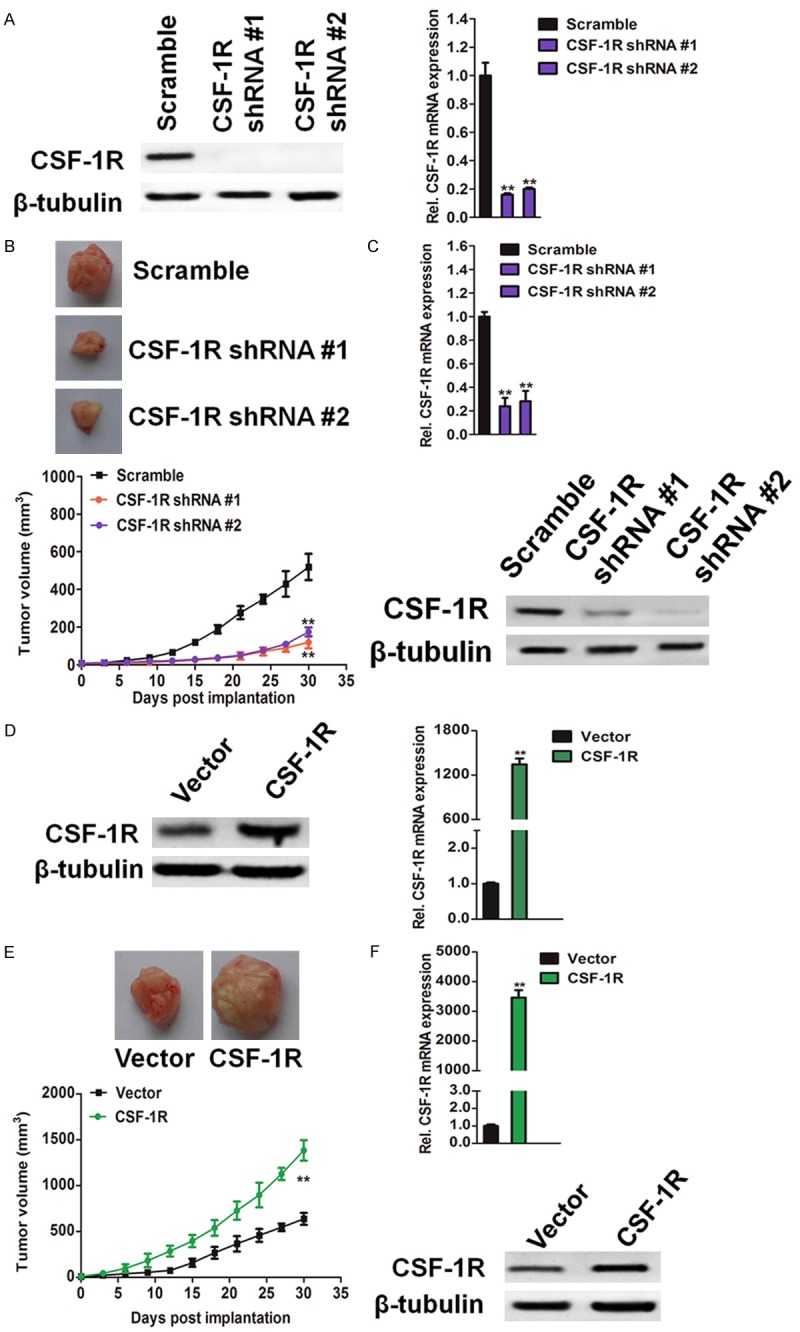
Osteosarcoma cells expressed CSF-1R promotes tumorigenicity in xenotransplanted tumor model. A: CSF-1R mRNA (left) and protein expression (right) by CSF-1R-shRNA #1 and CSF-1R-shRNA #2 versus vector control. PCR values were normalized to the levels of β-tubulin. Data were presented as the mean ± SD from three independent measurements. **P < 0.01, compared with control SW1353 cells. B: Tumor growth kinetics (mean ± SD) of SW1353-shRNA versus vector control SW1353 osteosarcoma cells in BALB/c nu/nu mice (n = 6 each). **P < 0.01, compared with mice inoculated with control cells. C: CSF-1R mRNA expression (mean ± SD) determined by qRT-PCR (upper) and western blotting analysis of CSF-1R protein expression (lower) of osteosarcoma tissues harvested post inoculation of SW1353-shRNA versus control SW1353 cells to BALB/c nu/nu mice, respectively. PCR values were normalized to the levels of β-tubulin. Data were presented as the mean ± SD from three independent measurements. **P < 0.01, compared with control SW1353 cells. D: CSF-1R mRNA (left) and protein expression (right) by CSF-1R over-expressing versus vector control. PCR values were normalized to the levels of β-tubulin. Data were presented as the mean ± SD from three independent measurements. E: Tumor growth kinetics (mean ± SD) of SW1353 over-expression versus vector control SW1353 osteosarcoma cells in BALB/c nu/nu mice (n = 6 each). **P < 0.01, compared with mice inoculated with control cells. F: CSF-1R mRNA expression (mean ± SD) determined by qRT-PCR (upper) and western blotting analysis of CSF-1R protein expression SW1353 (lower) of osteosarcoma harvested post inoculation of SW1353 over-expression versus vector control-transduced SW1353 cells to BALB/c nu/nu mice, respectively. PCR values were normalized to the levels of β-tubulin. Data were presented as the mean ± SD from three independent measurements. **P < 0.01, compared with vector control.