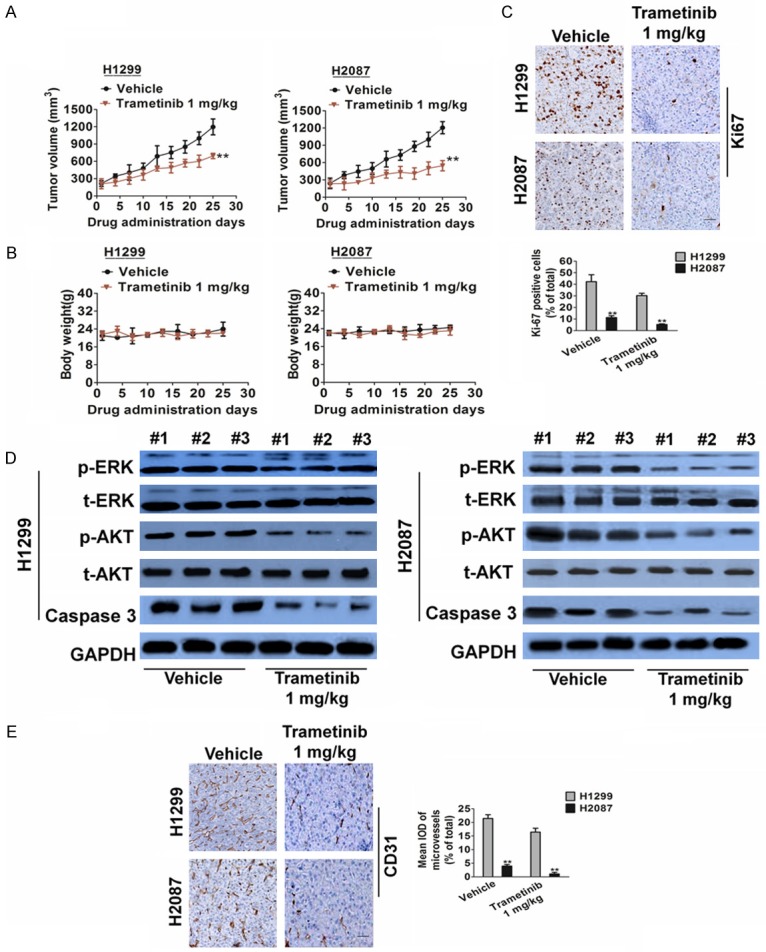
Figure 4.

Trametinib treatment inhibits angiogenesis in H1299 and H2087 xenograft models. A. Representative images of H1299 and H2087 tumors. Tumor growth curve of H1299 and H2087 xenografts. H1299 and H2087 xenografts were treated with trametinib 1 mg/kg or vehicle for 25 days after tumor volume reached an average of 100 to 200 mm3. Data are presented as means ± SD, n = 6, **P < 0.01 versus vehicle group. B. Body weight changes in trametinib and vehicle treated mice. Data are presented as means ± SD, n = 6. C. Representative images of Ki-67 staining in H1299 and H2087 xenografts. Scale bar represents 50 μm. Quantification of proliferating cells by Ki-67 staining in H1299 and H2087 xenografts. Data are presented as means ± SD, n = 6, **P < 0.01 versus vehicle group. D. Biochemical analysis of ERK, AKT and Caspase in protein extract of H1299 and H2087 xenografts. Protein loading was normalized by GAPDH. Three independent samples were evaluated. E. Tumor tissues were prepared for immunohistochemistry detection with antibody against CD31 (Scale bar represents 50 μm). Data are presented as means ± SD, n = 6, **P < 0.01 versus vehicle group.
