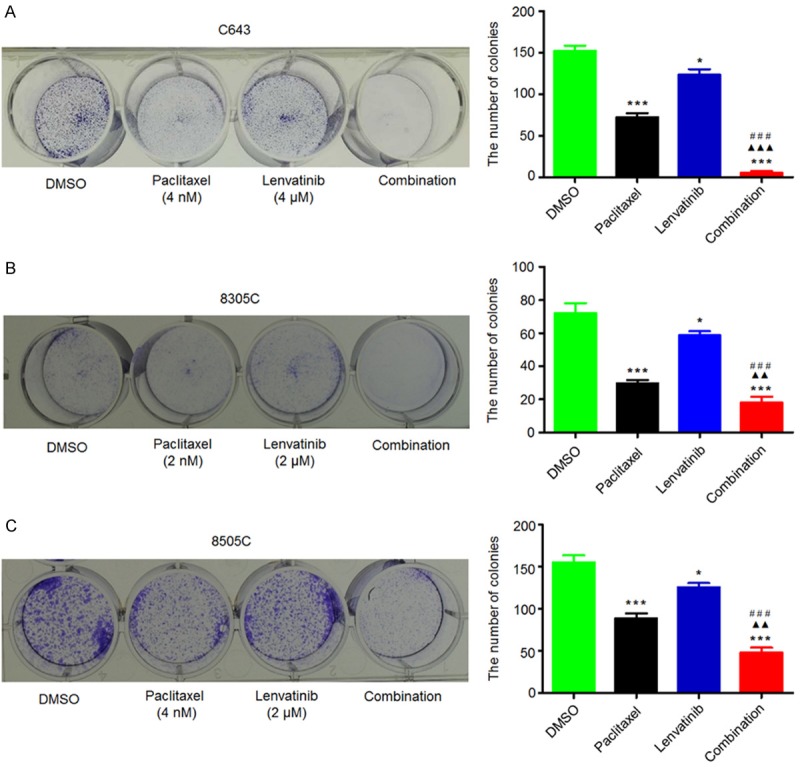
Figure 2.

Synergistic inhibition of colony formation of ATC cells by lenvatinib and paclitaxel. Representative images of colony formation in C643 (A), 8305C (B) and 8505C (C) cells treated with vehicle control (DMSO) or lenvatinib and paclitaxel at the indicated concentrations, individually or in combination, are shown in left panel. Quantitative analysis of colony numbers is shown in right panel. Data are presented as mean ± SD of values from three different assays. Statistically significant differences are indicated: *, P < 0.05; ***, P < 0.001 for comparison with control; ▲▲, P < 0.01; ▲▲▲, P < 0.001 for comparison with paclitaxel monotherapy; ###, P < 0.001 for comparison with lenvatinib monotherapy.
