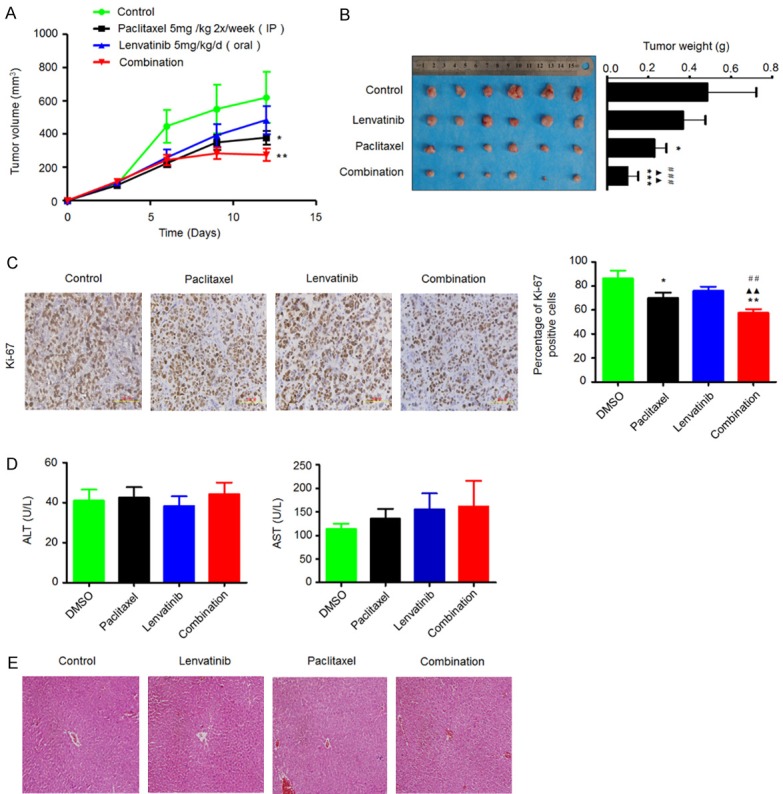
Figure 5.

Synergistic inhibition of the growth of C643-derived xenograft tumors by lenvatinib and paclitaxel. Time course of tumor growth (A) and animal weight (B) was measured in each group at the indicated time points of various treatments. Data are presented as mean ± SD (n=6/group). Representative images of tumors from mice treated with vehicle control, lenvatinib and paclitaxel, individually or in combination are shown in the left panel. Bar graphs represents mean tumor weight from mice with the indicated treatments (right panel). Data are presented as mean ± SD (n=6/group). (C) Representative Ki-67 stained sections of xenograft tumors from different groups are shown in the left panel. Bar graphs represent mean ± SD of the numbers of Ki-67-positive cells from 5 microscopic fields in each group (right panel). (D) Serum levels of aspartate transaminase (AST) and alanine transaminase (ALT) were measured in the indicated mice by spectrophotometric methods. Data are presented as mean ± SD (n=6/group). (E) Representative H&E stained liver sections from the indicated mice. Statistically significant differences are indicated: *, P < 0.05; **, P < 0.01; ***, P < 0.001 for comparison with control; ▲▲, P < 0.01 for comparison with paclitaxel monotherapy; ##, P < 0.01; ###, P < 0.001 for comparison with lenvatinib monotherapy.
