
Figure 1.
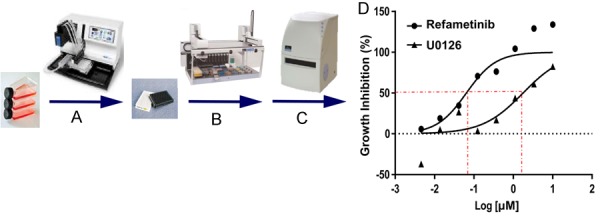
High Throughput Screening (HTS) workflow. A. Cells were plated in 384 well assay; B. 50 nL of compounds were transferred into each well via the JANUS Automated Workstation (Perkin Elmer) and then incubated for 72 hrs; C. Luminescence was measured by ATPlite Luminescence Assay; D. Raw data values were normalized and log-transformed to produce a dose-response curve. IC50s were determined to be the concentration of drug tested that resulted in 50% response.