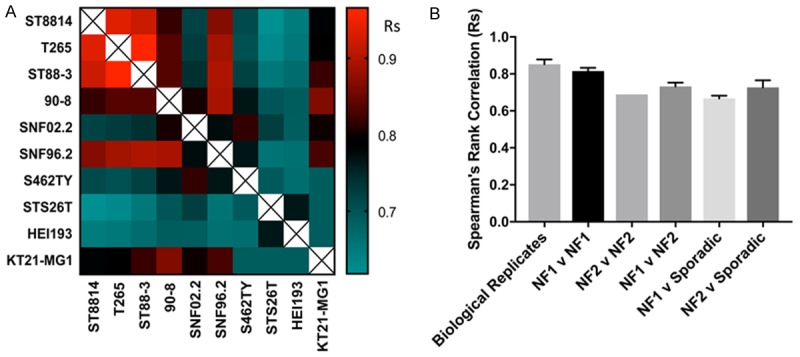
Figure 3.

Concordance of Drug Sensitivity amongst cell lines and replicates. A. Heat map of Spearman’s rank correlation coefficients between IC50 values for indicated conditions. Warmer colors (red) represent higher correlation coefficients, while cooler colors (blue) represent lower correlation coefficients. B. Selected comparisons of Spearman’s rank correlation coefficients shown in part A. In this analysis, all Spearman’s rank correlation coefficients were included when multiple runs of the same human cell line were performed. Error bars represent standard error of the mean. Note that NF1 cell lines compared to each other are almost the same as biological replicates.
