
Figure 3.
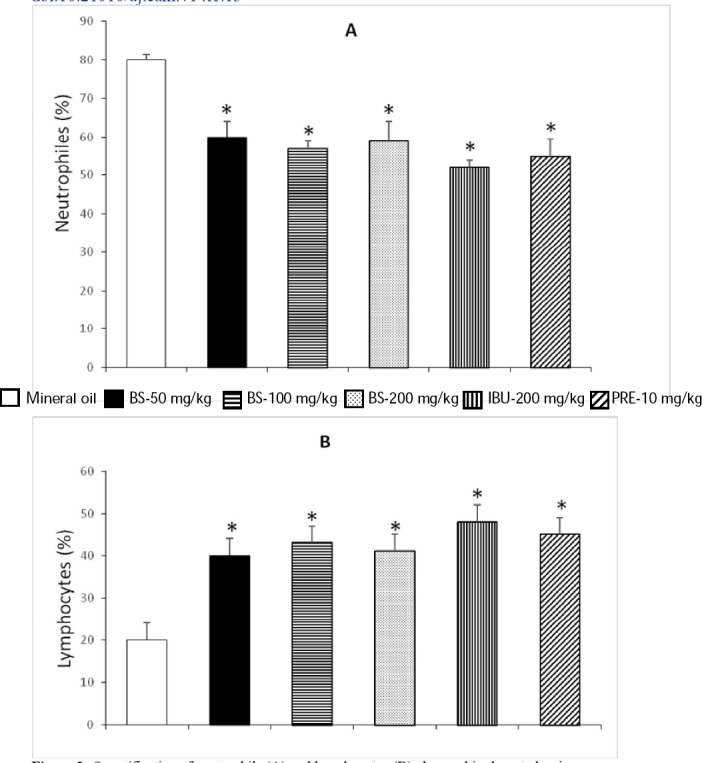
Quantification of neutrophils (A) and lymphocytes (B) observed in the rat pleurisy assay
IBU = Ibuprofen; PRE = Prednisone. Each bar represents the mean ± SEM of five animals per group. *Statistically significant difference with respect to the result obtained for mineral oil; ANOVA and Student t tests, p<0.05