
Figure 7.
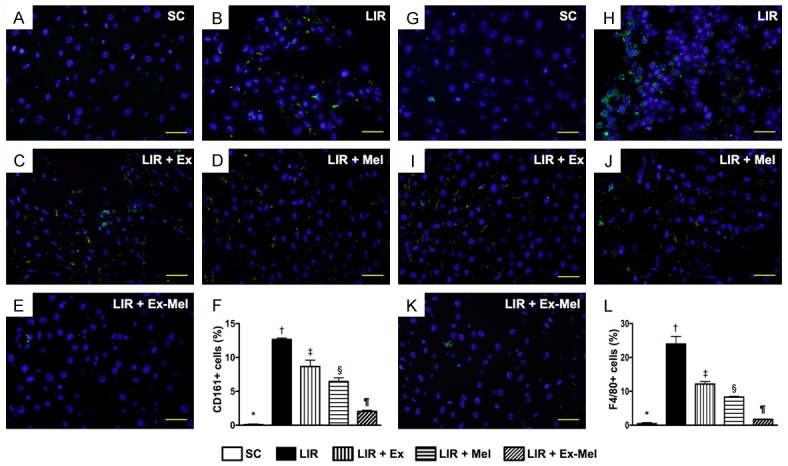
Immunofluorescent (IF) staining for identification of inflammatory cell (CD161+, F4/80+) infiltration in liver parenchyma 72 hours after reperfusion. (A to E) IF microscopy (400 x) showing CD161+ cells (green) in liver parenchyma. Scale bars in right lower corner represent 20 µm. F: Differences in number of CD161+ cells among different groups, * vs. other groups with different symbols (†, ‡, §, ¶), P<0.0001. (G to K) Identification of F4/80+ cells (green) in liver parenchyma using IF microscopy (400 x). Scale bars in right lower corner represent 20 µm. (L) Mean number of F4/80+ cells in different groups, * vs. other groups with different symbols (*, †, ‡, §, ¶), P<0.0001. All statistical analyses were performed by one-way ANOVA, followed by Bonferroni multiple comparison post hoc test (n = 10 for each group). Symbols (*, †, ‡, §, ¶) indicate significant differences (at 0.05 level). SC = sham control; LIR = liver ischemia reperfusion; Ex = exosome; Mel = melatonin.