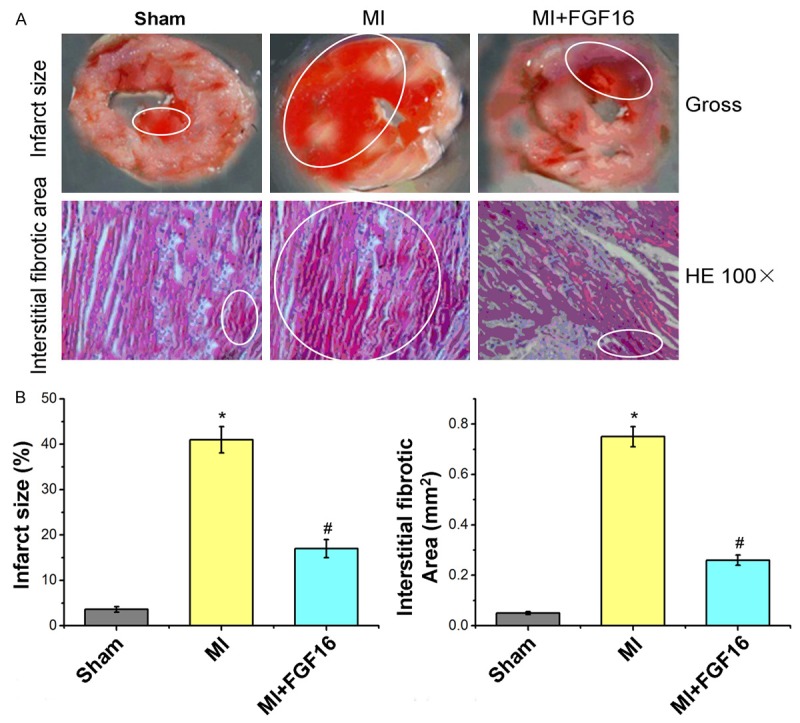
Figure 1.

Effect of FGF-16 on infarct size and interstitial fibrotic areas after MI. A. Images for infract size areas and interstitial fibrotic areas (%; n=15); B. Statistical analysis for infarct size and Interstitial fibrotic area (mm2; n=15). P<0.05 represents the infarct size or interstitial fibrotic areas in MI group compared to Sham group or in MI+FGF16 group compared to MI group. *P<0.05 represents infarct size or interstitial fibrotic area in MI group compared to Sham group. #P<0.05 represents infarct size or interstitial fibrotic area in MI+GFG16 compared to MI group.
