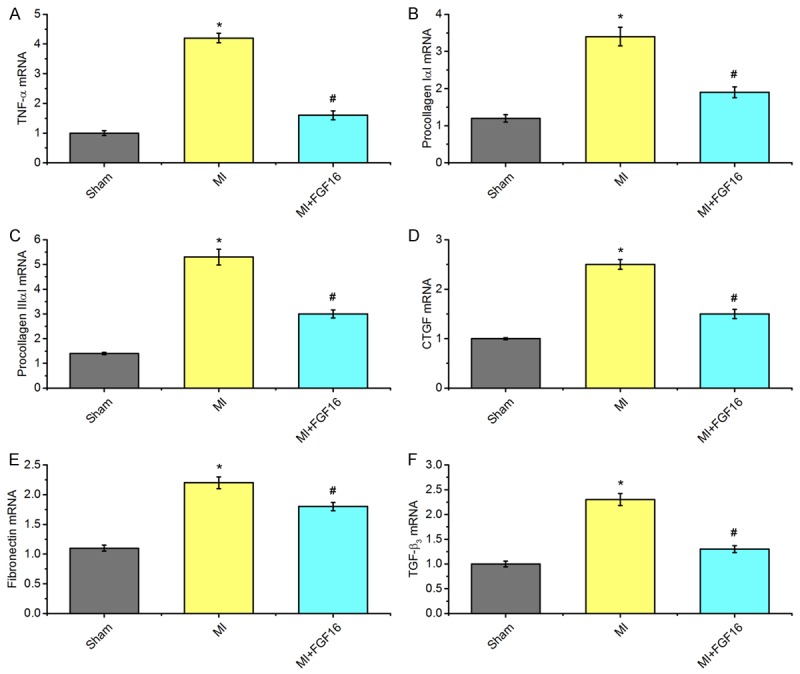
Figure 3.

Effect of FGF-16 on cardiomyocyte remodelling after MI. A-F. quantification data of mRNA expression of cardiomyocyte genes by real-time RT-PCR (n=15). P<0.05 represents the gene levels in MI group compared to Sham group or in MI+FGF16 group compared to MI group. *P<0.05 represents the mRNA levels in MI group compared to Sham group. #P<0.05 represents mRNA levels in MI+GFG16 compared to MI group.
