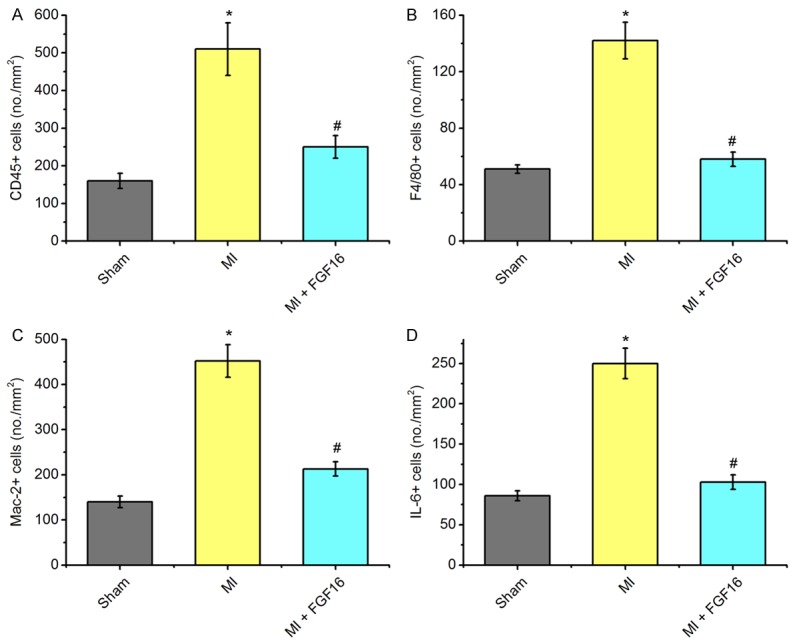
Figure 4.

Effect of FGF-16 on myocardial inflammation after MI. A-D. Quantification data CD45, F4/80, Mac-2, and IL-6 staining to assess leukocyte and macrophage infiltration from sham, MI, and MI+FGF16 groups (n=15). P<0.05 represents the cell levels in MI group compared to Sham group or in MI+FGF16 group compared to MI group. *P<0.05 represents the values in MI group compared to Sham group. #P<0.05 represents values in MI+GFG16 compared to MI group.
