Figure 1.

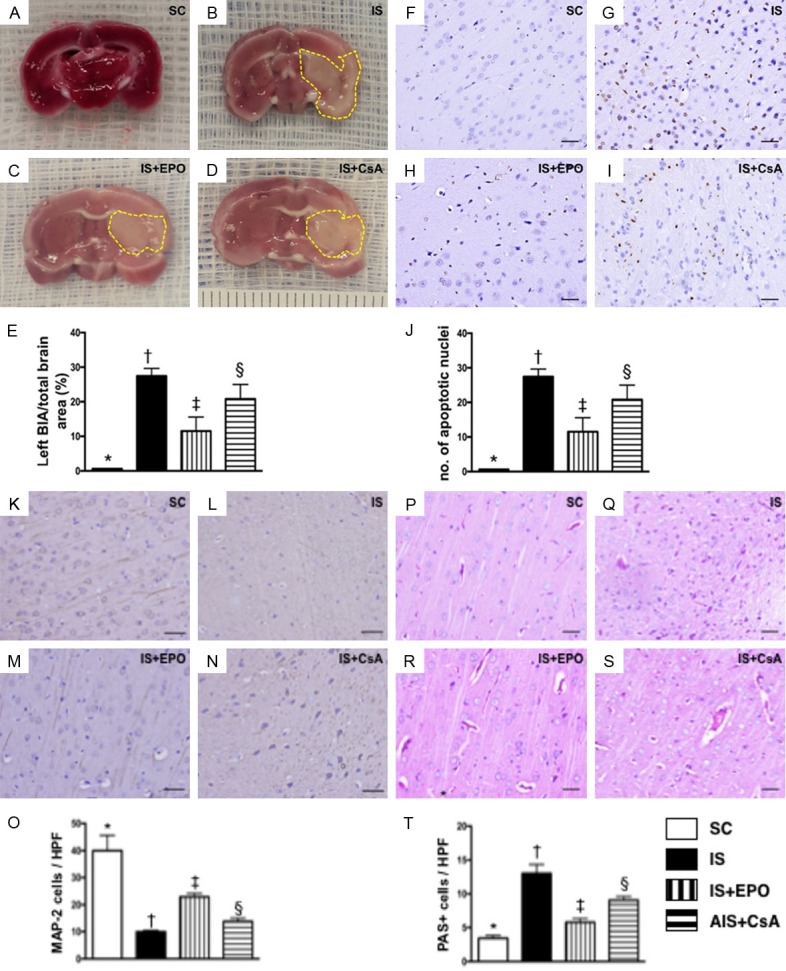
3,5-Triphenyl-2H-Tetrazolium Chloride (TTC) staining and TUNEL assay for assessment of brain damage, and identification of integrity of neuron cytoskeletal protein and expression of glycogen/glycoprotein by day 3 after acute IS. A-D. Illustration of TTC staining of brain tissues for identification of brain infarct area (BIA) (whitish color identified by yellow dotted line). E. BIA/total brain area (TBA), * vs. other groups with different symbols (†, ‡, §), P<0.0001. F-I. Illustrating microscopy (400×) with immunohistochemical staining (i.e., by TUNEL assay) of apoptotic nuclei (gray color). J. Number of apoptotic nuclei in BIA, * vs. other groups with different symbols (†, ‡, §), P<0.0001. Scale bars in right lower corner represent 20 µm. K-N. Microscopy (200×) of microtubule associated protein 2 (MAP-2) staining for identification of neuron-specific cytoskeletal protein (spindle shaped with gray color). O. Number of positively stained neuron-specific cytoskeletal protein, * vs. other groups with different symbols (†, ‡, §), P<0.0001. P-S. Microscopy (200×) for periodic acid-Schiff (PAS) for detecting the expression of glycogen/glycoprotein in BIA (pink color). T. Number of PAS+ cells, * vs. other groups with different symbols (†, ‡, §), P<0.0001. Scale bars in the right lower corner represent 50 µm. All statistical analyses were performed by one-way ANOVA, followed by Bonferroni multiple comparison post hoc test (n = 6 for each group). Symbols (*, †, ‡, §) indicate significance at the 0.05 level. SC = sham control; IS = ischemic stroke; EPO = erythropoietin; CsA = cyclosporine; BIA = brain infarct area.
