
Figure 2.
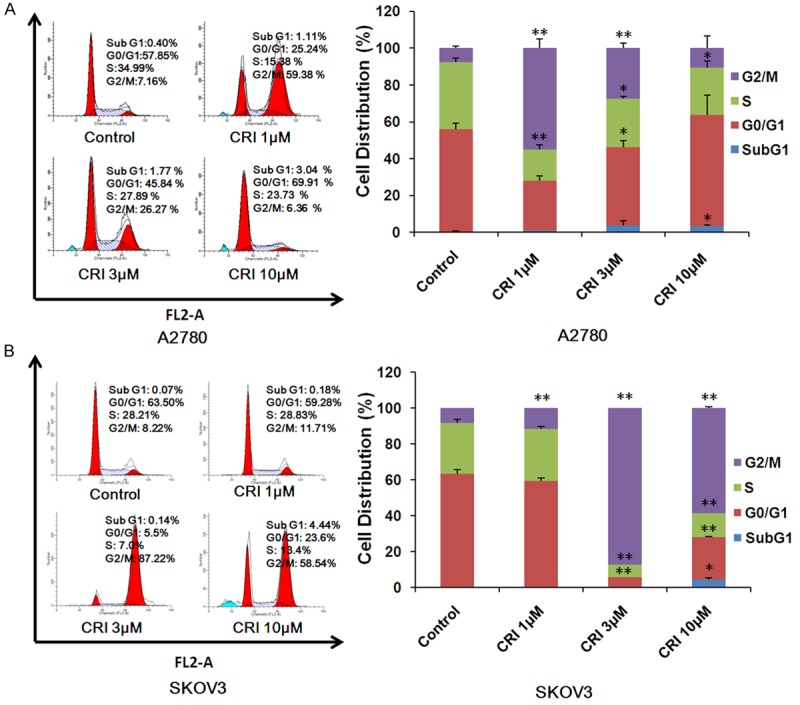
Crizotinib arrests ovarian cancer cell cycle at G2/M phase. A2780 (A) and SKOV3 (B) cells were treated with crizotinib at the indicated concentrations. The distribution of cell cycle was examined by FCM with PI staining. The percentages of subG1, G1/G0, S, G2/M phase were calculated by using ModFit LT 3.0 software. The results of three independent experiments were shown through the representative and quantified charts. CRI: Crizotinib. Statistical analysis of the difference between two groups is performed with Student’s t-test. *P<0.05 and **P<0.01 vs. corresponding control.