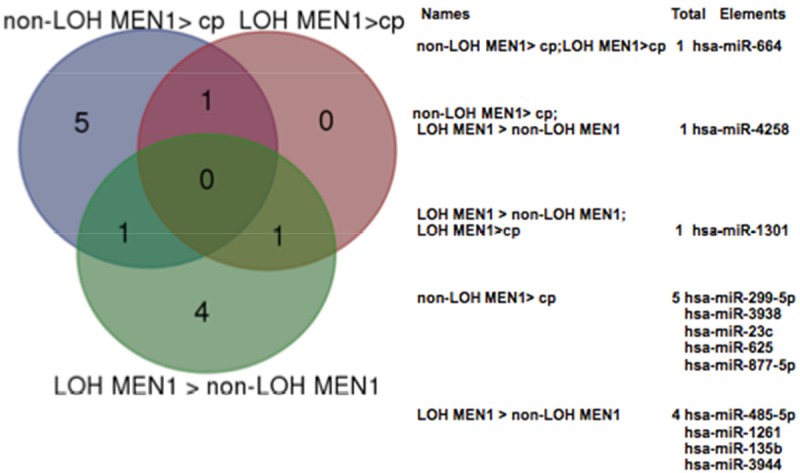
Figure 4.

Comparisons of miRNA expression in parathyroid adenoma: the Venn diagram shows the number of miRNAs differentially expressed in LOH MEN1 parathyroid adenomas vs non-LOH/MEN1 parathyroid adenomas, LOH MEN1 parathyroid vs control pool and non-LOH/MEN1 parathyroid adenomas vs control pool. cp = control pool.
