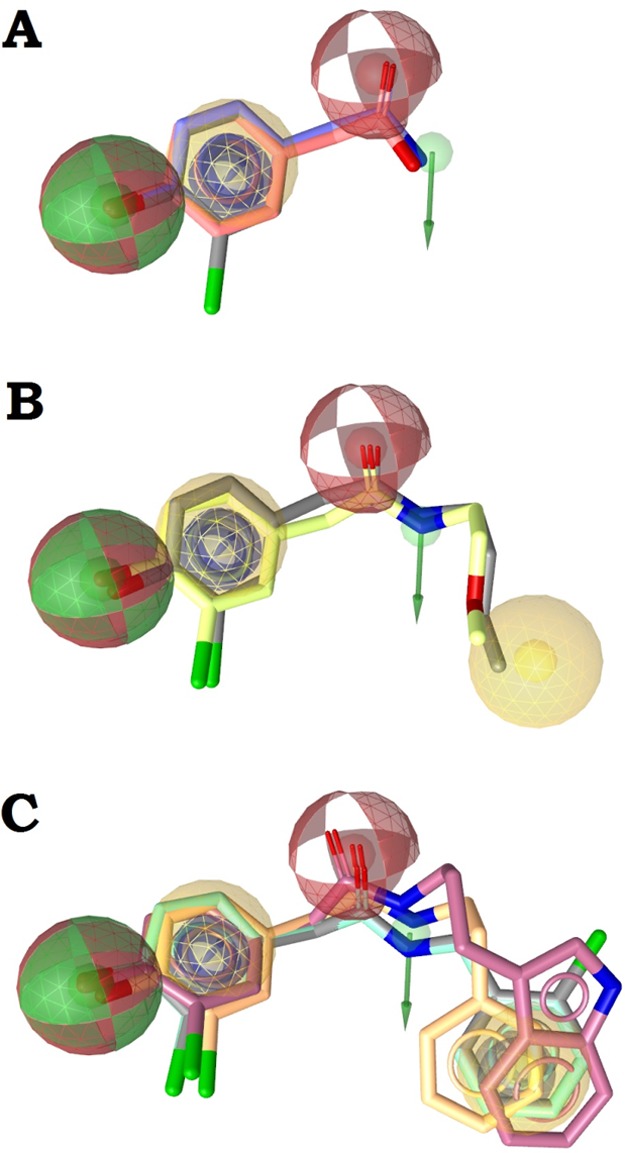
Figure 5.

Illustration of the SAR of semisynthetic natural product derivatives (Table 3). (A) The core structure with compounds S12 (gray), S15 (red), and S11 (blue) with a pharmacophore model illustrating the interaction pattern. (B) The moderately active compounds 14 (yellow) and 15 (gray) with the additional hydrophobic feature. (C) The most active compounds 13 (orange), N-benzyl-2-(3-chloro-4-hydroxyphenyl)acetamide (16, green), N-(2-(1H-indol-3-yl)ethyl)-2-(3-chloro-4-hydroxyphenyl) (17, purple), and 18 (gray) with the additional aromatic ring feature.
