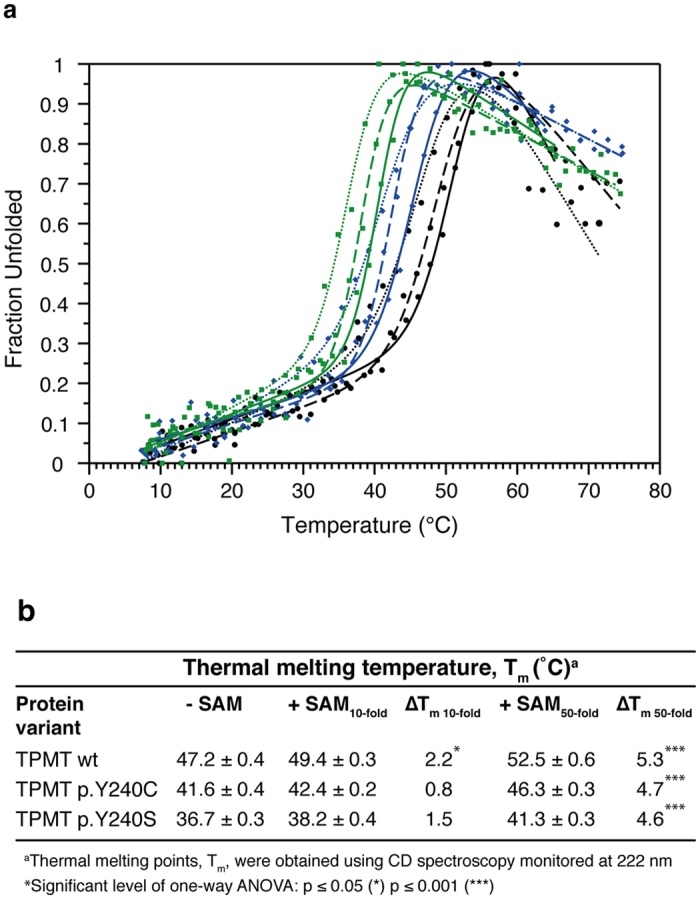
Figure 3.

(a) Thermal stability of TPMTwt (black), TPMT p.Y240C (blue) and TPMT p.Y240S (green) in 10-fold (dashed line), 50-fold (solid line) molar excess of SAM or absence (dotted line) of SAM. Data from one representative measurement of each protein sample are shown in the graph. (b) Table showing thermal denaturation temperatures for TPMTwt, TPMT p.Y240C and TPMT p.Y240S. The thermal denaturation temperatures shown are determined by using the CDpal software45 and merging all data points from each individual measurement. Data were fitted to the merged points using a two-state denaturation model.
