
Figure 1.
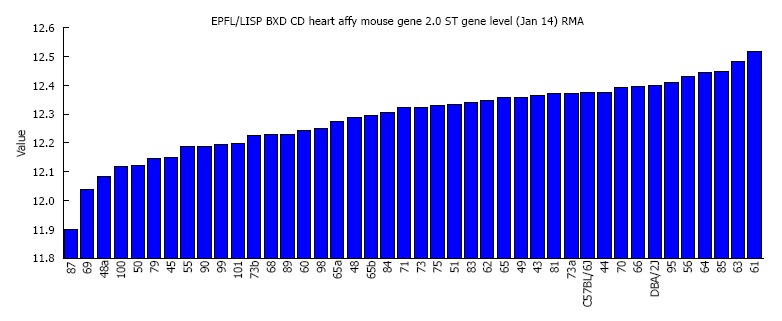
Rank-ordered expression of Mypn in the heart across the 40 BXD strains and their parental strains. The X-axis denotes the strain name while the Y-axis denotes the mean expression given in a LOG2 scale.
Official websites use .gov
A
.gov website belongs to an official
government organization in the United States.
Secure .gov websites use HTTPS
A lock (
) or https:// means you've safely
connected to the .gov website. Share sensitive
information only on official, secure websites.
Rank-ordered expression of Mypn in the heart across the 40 BXD strains and their parental strains. The X-axis denotes the strain name while the Y-axis denotes the mean expression given in a LOG2 scale.