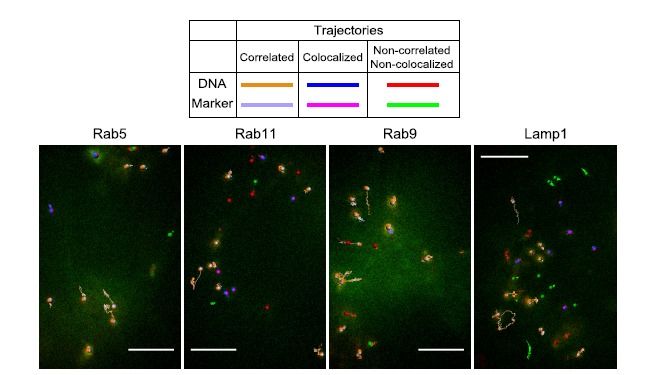
Fig. (15).

Dual-color SPT of DNA aggregates and endosomal proteins in CHO cells after electroporation. CHO cells separately expressing EGFP-Rab5, Rab11, Rab9 and Lamp1 plasmid constructs were electroporated in the presence of Cy5-labeled DNA. Using quantitative colocalization analysis, the respective movements of the objects are investigated. Correlated trajectories are highlighted in orange (DNA) and light purple (EGFP-markers), colocalized trajectories are drawn in blue (DNA) and pink (EGFP-markers) and the non-correlated and non-colocalized trajectories are in red (DNA) and green (EGFP-markers). (a) DNA in early endosomes (Rab5), (b) DNA in recycling endosomes (Rab11), (c) DNA in late endosomes (Rab9), and (d) DNA in lysosomes (Lamp1). Scale bar: 5 µm. From [251].
