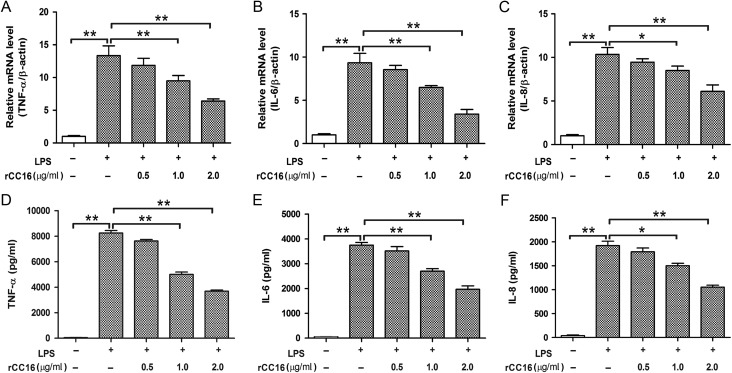
Figure 2.
Effect of rCC16 on LPS-induced TNF-α, IL-6, and IL-8 expression in RAW264.7 cells (A–F) Real-time PCR (A–C) and ELISA assays (D–F) showed the inhibition of LPS-stimulated TNF-α, IL-6, and IL-8 expression by rCC16 in a concentration-dependent manner. RAW264.7 cells were incubated for 2 h with 0–2.0 μg/ml rCC16 and then exposed to 0.1 μg/ml LPS for another 24 h. For qPCR determinations, the results are expressed as ratios of 2−∆∆CT qPCR values for TNF-α, IL-6, and IL-8 mRNA/β-actin. For ELISA determinations, the results are expressed as the absolute protein values of TNF-α, IL-6, and IL-8. The data are presented as the mean ± SD of three independent experiments. *P < 0.05 and **P < 0.01 indicate significant differences between groups as shown. qPCR, quantitative polymerase chain reaction; TNF-α, tumor necrosis factor alpha; IL-6, interleukin-6; LPS, lipopolysaccharide; mRNA, messenger RNA; ELISA, enzyme-linked immunosorbent assay.

