
Fig. 3.
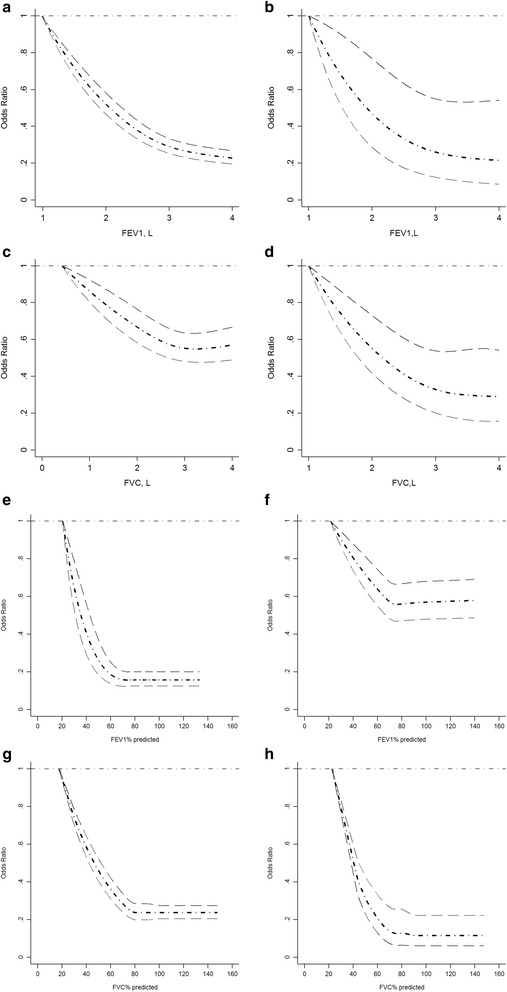
Dose-response relationship between adjusted odds ratio for reduced renal function and lung capacity measures. a Dose-response relationship between FEV1 and adjusted odds ratio for reduced renal function (eGFR < 60 mL/min/1.73 m2) in Nanjing survey; (b) Dose-response relationship between FEV1 and adjusted odds ratio for reduced renal function (eGFR < 60 mL/min/1.73 m2) in Crossroads study; (c) Dose-response relationship between FVC and adjusted odds ratio for reduced renal function (eGFR < 60 mL/min/1.73 m2) in Nanjing survey; (d) Dose-response relationship between FVC and adjusted odds ratio for reduced renal function (eGFR < 60 mL/min/1.73 m2) in Crossroads study. e Dose-response relationship between FEV1% predicted value and adjusted odds ratio for reduced renal function (eGFR < 60 mL/min/1.73 m2) in Nanjing survey; (f) Dose-response relationship between FEV1% predicted value and adjusted odds ratio for reduced renal function (eGFR < 60 mL/min/1.73 m2) in Crossroads study; (g) Dose-response relationship between FVC% predicted value and adjusted odds ratio for reduced renal function (eGFR < 60 mL/min/1.73 m2) in Nanjing survey; (h) Dose-response relationship between FVC% predicted value and adjusted odds ratio for reduced renal function (eGFR < 60 mL/min/1.73 m2) in Crossroads study; FEV1, forced expiratory volume in 1 s; FVC, forced vital capacity. People with minimum FEV1 or FVC was used as reference group. Age, gender, smoking status, waist circumference, systolic blood pressure, triglyceride, and high density lipoprotein cholesterol were adjusted