Fig. 3.

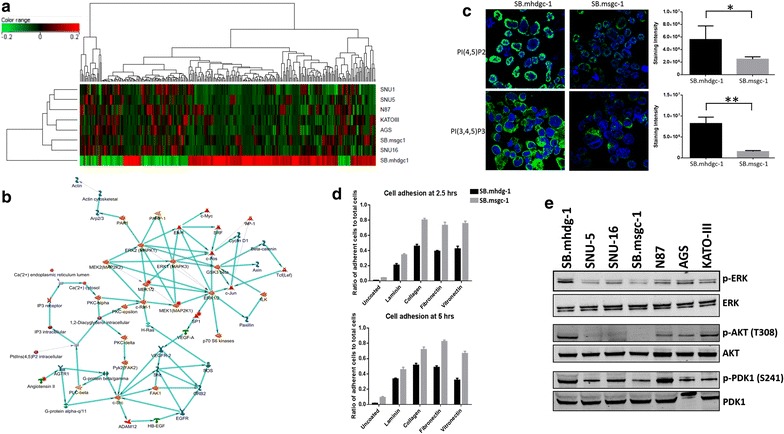
c.1380delA CDH1 SB.mhdgc-1 harbors select transcriptomic alterations compared to sporadic gastric cancer cells. a Unsupervised hierarchical cluster analysis and associated heat map of baseline transcriptomic profiles. Columns represent individual probes while rows represent individual cell lines. The color of each probe reflects log2 ratio of normalized expression values for each cell line compared to the median from all cell lines (see scale, top 200 upregulated and 100 downregulated (FC > 2; p < 0.05) in c.1380delA CDH1 SB.mhdgc-1 shown). b Most relevant network selective for SB.mhdgc-1 cells by GeneSpring GX analyze networks (AN) algorithm using shortest paths algorithm with main parameters (1) relative enrichment and (2) relative saturation of networks with canonical pathways. Networks are prioritized based on the number of fragments of canonical pathways in the network. c c.1380delA CDH1 SB.mhdgc-1 gastric cancer cells harbor increased phosphoinositide-derived messengers. Immunofluoresence of SB.mhdgc-1 and sporadic SB.msgc-1 gastric cancer cells measuring anti-phosphatidylinositol 4,5-bisphosphate (top) and anti-phosphatidylinositol 3,4,5-trisphosphate levels (bottom). Mean of staining intensity normalized to DAPI of 100 cells of SB.mhdgc-1 and SB.msgc-1 shown on the right. d Reduced cell adhesion including extracellular matrix substrate adhesion of c.1380delA CDH1 SB.mhdgc-1 versus SB.msgc-1 cells. Time course of ratios of adherent versus non-adhered cells (student’s t test; two images were acquired of each triplicate and the mean taken). e Increased p-ERK: total ERK and p-AKT: total AKT protein expression ratios in c.del1380A CDH1 SB.mhdgc-1 cells compared to sporadic gastric cancer cell lines. Immunoblots with antibodies indicated on the right
