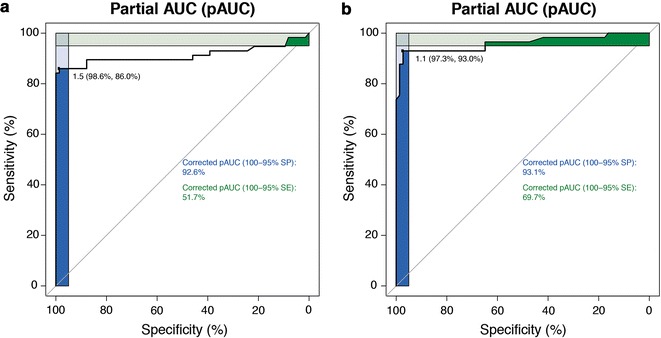
Fig. 1.

ROC curves for Q-PCR (a) and Q-RT-PCR (b) compared to FISH in non-equivocal cases. The blue and green squares represent the corrected partial areas under the curve (pAUC) for the graphic regions encompassing the 100–95% specificity and sensitivity areas, respectively. The value on the topleft corner of each panel indicates the optimal cutoff, with specificity and sensitivity in parentheses
