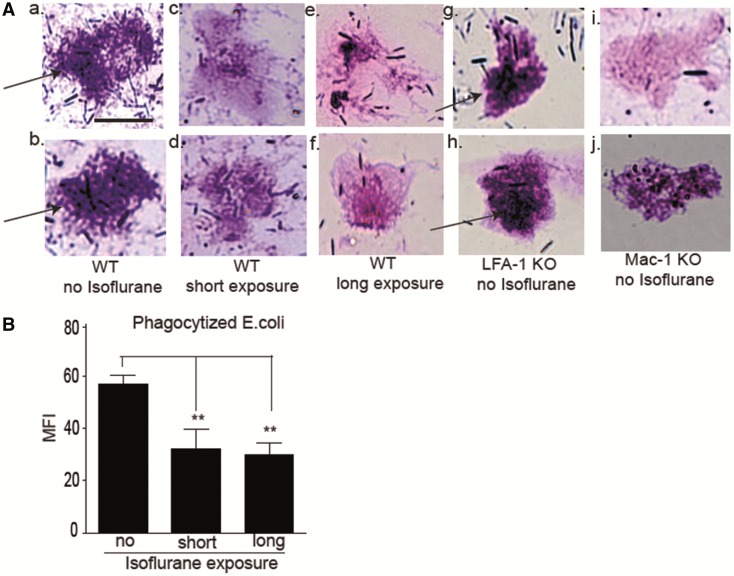
FIG. 5.
The effect of isoflurane exposure on bacterial phagocytosis. A, Representative images of peritoneal leukocytes from mice 12 h after CLP. (a) and (b), WT mice with no isoflurane exposure; (c) and (d), WT mice with isoflurane short exposure; (e) and (f), WT mice with long isoflurane exposure; (g) and (h), LFA-1 KO mice with no isoflurane exposure; (i) and (j), Mac-1 KO mice with no isoflurane exposure. Arrows indicate bacteria. Scale bar 10 µm. B, Whole blood phagocytosis assay using fluorescent E. coli. Mice in the short isoflurane exposure group received 1% isoflurane for 2 h and then were kept in cages for 4 h before blood collection. The long exposure group received 1% isoflurane for 6 h and then blood was collected immediately. Gated on neutrophil population. Data represent mean ± SD of 4 mice. Statistical significance was analyzed using 1-way analysis of variance with Bonferroni post hoc analysis. * and ** denote P < .05 and .01, respectively versus mice without isoflurane exposure. MFI, mean fluorescence intensity.

