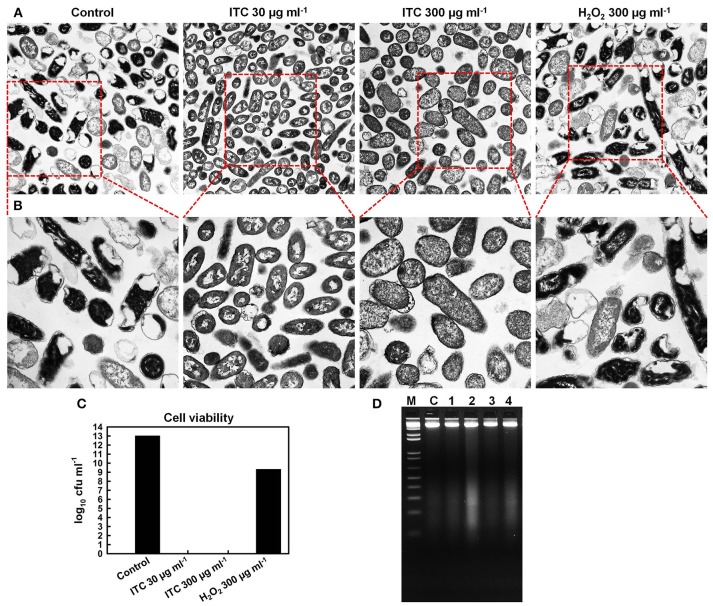
Figure 6.
Effect of ITC on cellular components of E. coli. Transmission electron micrographs of untreated control, treated with ITC at 30 and 300 μg ml−1, and H2O2 at 300 μg ml−1 for 2 h, and visualized at 10,000× (A) and at 20,000× magnifications (B). Cell counts (log10 cfu ml−1) of viable E. coli cells from the same samples prior to preparation for TEM (C). Bacterial DNA damage detection by agarose gel electrophoresis (D). Samples 1, 2, 3, and 4 E. coli cells were treated 30 min with ITC at 30 and 300 μg ml−1, H2O2 at 30 and 300 μg ml−1, respectively. gDNA was extracted and gel electrophoresis was performed for examination of DNA cleavage (DNA smear). C is gDNA from untreated cells, M is a 1 kb DNA marker.

