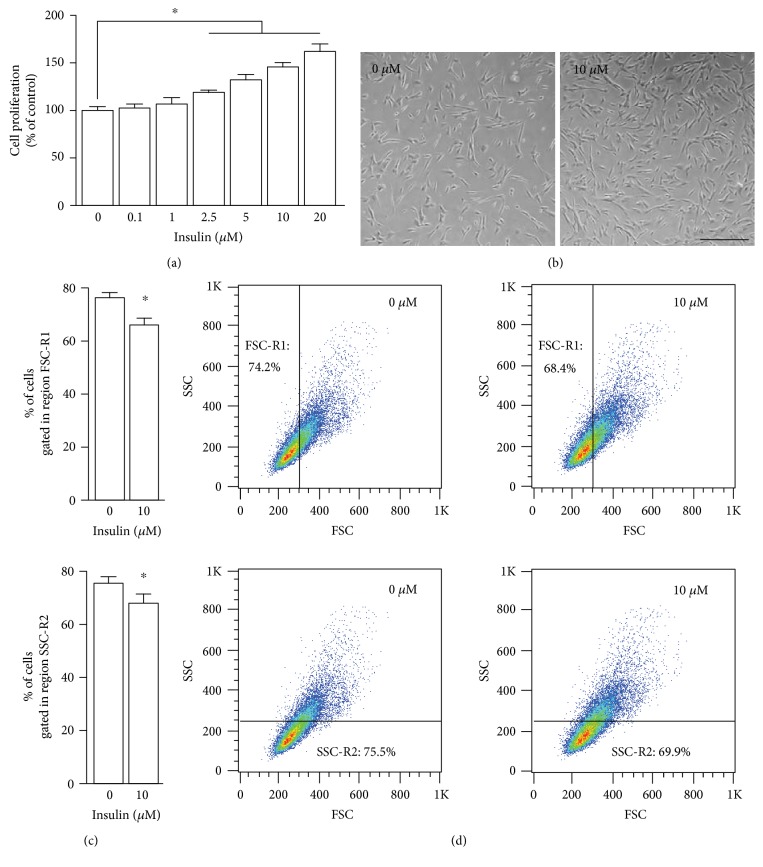
Figure 1.
Effects of insulin on the proliferation, morphology, and growth of UCM-MSC in SFM. (a) Proliferation of UCM-MSC cultured in SFM without or with insulin. UCM-MSC were incubated in SFM supplemented with increasing dosages of insulin (0–20 μM) for 72 h, and proliferation of UCM-MSC was measured by CCK-8 assays. Values are adjusted relative to the proliferation of the nontreatment control, which was set to 100%. (b) Photomicrograph of UCM-MSC cultured in SFM for 72 h with or without 10 μM insulin (scale bar, 100 μm). (c, d) UCM-MSC incubated in SFM containing 0 and 10 μM insulin for 72 h were subjected to flow cytometry, and the cell size and internal complexity were analyzed as described in Section 2.5. Bar graphs (c) show the results of three separate experiments and represent the difference in size (top, FSC-R1) and internal complexity (bottom, SSC-R2). Two-dimensional plots (d) show a representative experiment. All data are represented as mean ± SD, and error bars indicate SD (n = 3). ∗p < 0.05 versus nontreated control cells by one-way ANOVA with Fisher's test for (a) and Student's t-test for (c).

