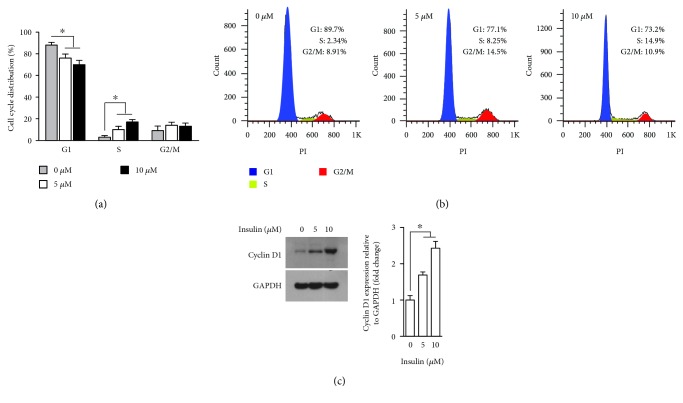
Figure 2.
Effects of insulin on the cell cycle distribution and cyclin D1 expression in UCM-MSC. (a, b) UCM-MSC incubated in SFM with 0, 5, and 10 μM insulin for 72 h were subjected to flow cytometry, and the percentages of cells in different cell cycle phases (G1, S, and G2/M) were measured using PI. The bar graph (a) shows the results of three independent experiments and represents the alterations in the cell cycle distribution of UCM-MSC following treatment with the indicated dosages of insulin. Histograms (b) show the data from a representative experiment. (c) UCM-MSC grown in SFM were exposed to 0, 5, and 10 μM insulin for 72 h, and the expression levels of cyclin D1 and GAPDH were assessed by Western blotting. Left, representative blots presenting the protein level of cyclin D1 in UCM-MSC treated with or without the indicated concentrations of insulin (GAPDH served as an internal control for protein loading); right, bar plot showing the cyclin D1/GAPDH ratio, as determined by densitometric analysis of Western blots and expressed as fold change compared with the nontreatment control (n = 3). For all panels, data are shown as mean ± SD. ∗p < 0.05 versus nontreated control cells by one-way ANOVA with Fisher's test.

