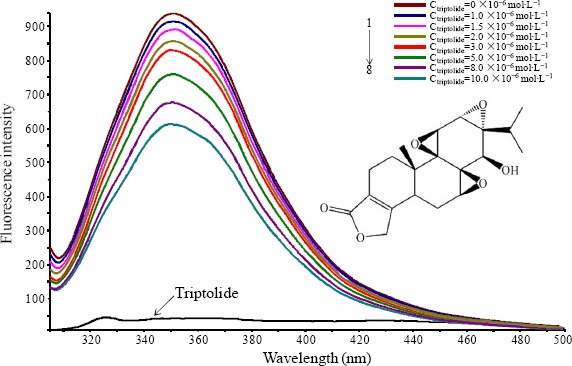
Figure 1.

Chemical structure of triptolide and the fluorescence quenching spectra of BSA at different concentrations of triptolide (T=298 K, pH=7.4); from curve 1 to 8, CBSA= 5.0×10⁻⁶ mol•L-1, Ctrlptollde=0, 1.0, 1.5, 2.0, 3.0, 5.0, 8.0, 10.0×10⁻⁶ mol•L−1
