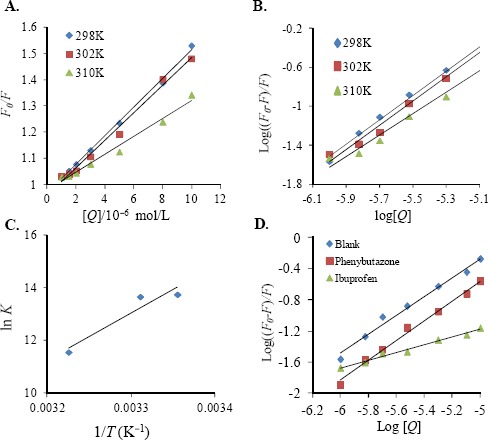
Figure 2.

A. Stern–Volmer plot for the quenching of BSA by triptolide at different temperatures
a. B. Double-log plots of triptolide quenching effect on BSA fluorescence at different temperatures
a. Double-log plots of triptolide quenching effect on BSA fluorescence in at 298 K in the presence of site markers. C. The Van’t Hoff plot for the interaction of BSA and triptolide at different temperatures. D. Double-log plots of triptolide quenching effect on BSA fluorescence in at 298 K in the presence of site markersa,b.
a CBSA=5.0×10⁻⁶ mol•L−1, Ctriptolide =1.0, 1.5, 2.0, 3.0, 5.0, 8.0, 10−6 mol•L−1
b CBSA=Cphenylbutazone= Cibuprofen=5.0×10⁻⁶ mol•L−1
*F and F0 are the fluorescence intensities in the presence and absence of quencher
