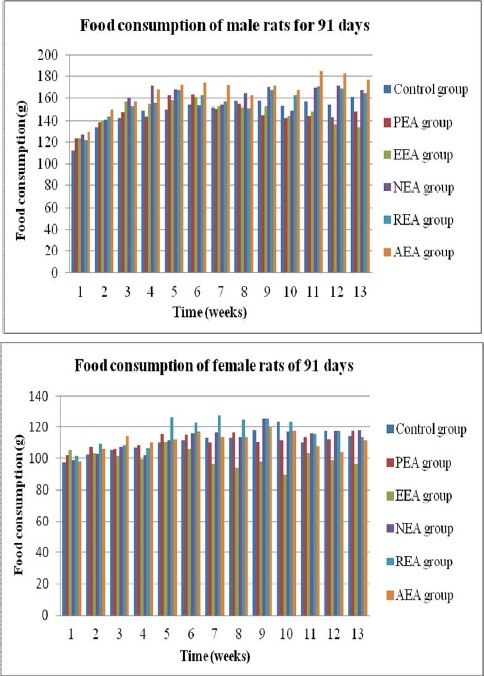
Figure 2.

Average weekly food consumption.
Values are presented as the mean ± SD (6 rats/sex/group). * = significant difference compared with the control group at P < 0.05.

Average weekly food consumption.
Values are presented as the mean ± SD (6 rats/sex/group). * = significant difference compared with the control group at P < 0.05.