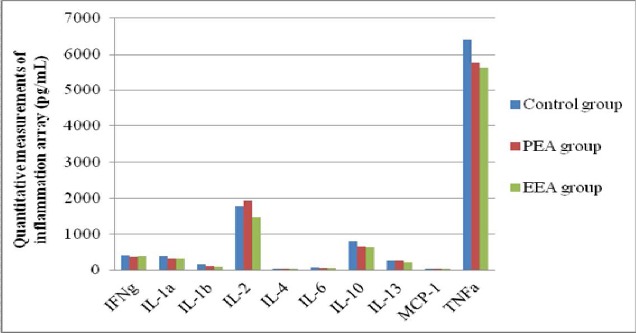
Figure 3.

Quantitative measurements of cytokines. Values are means ± SEM for 4 rats in each of the PEA, EEA and Control groups.
*P < 0.05, **P < 0.01 (extract groups vs. controls).

Quantitative measurements of cytokines. Values are means ± SEM for 4 rats in each of the PEA, EEA and Control groups.
*P < 0.05, **P < 0.01 (extract groups vs. controls).