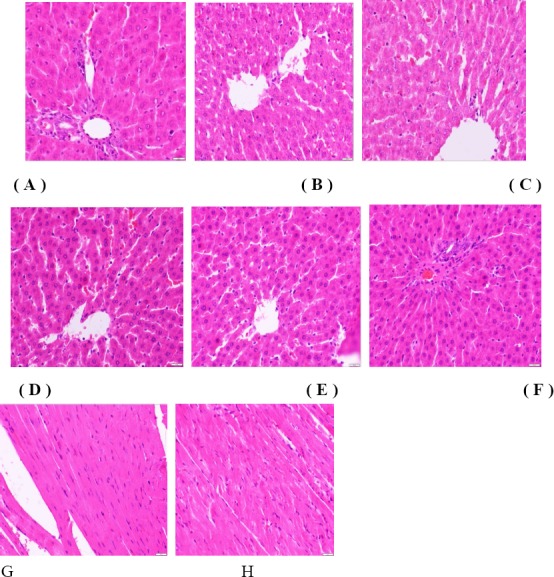
Figure 5.

Histopathological photomicrographs obtained at 91 days.
Photomicrographs of liver tissue from the control group (A) and B,C,D,E,F for PEA, EEA, NEA, REA,ANA group. Image G shows the condition of the heart in normal rats, and H shows that of the PEA group. All of the samples were stained with haematoxylin and eosin (40x).
