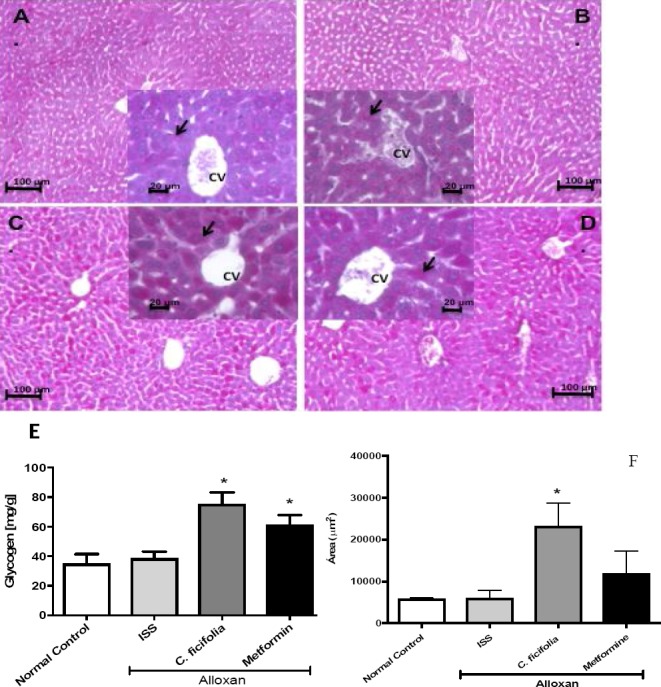
Figure 2.

Photomicrographs with PAS staining in pink of transversal liver sections by administration during 30 days of C. ficifolia-extract (200 mg/kg/day, equivalent to 11.6 μg/kg/day of p-coumaric acid) or metformin (50 mg/kg/day) in alloxan-induced diabetic mice. A) Normal control. B) Diabetic control (Alloxan ISS). C) Alloxan treated with C. ficifolia. D) Alloxan treated with metformin. C. ficifolia extract increased the accumulation of liver glycogen. Hepatocyte cytoplasm with dense glycogen deposits (arrow) around the central vein (CV) can be observed. These accumulations are seen as pink PAS-positive areas throughout the section (original magnification 100x and box 400x). E) Quantitative analysis of glycogen content in diabetic mice liver tissue treated for 30 days with C. ficifolia extract. F) Quantitative analysis of positive PAS stained area. Mean±S.E.M. (n=5). *Significant difference against diabetic control (Alloxan ISS) (p<0.05).
