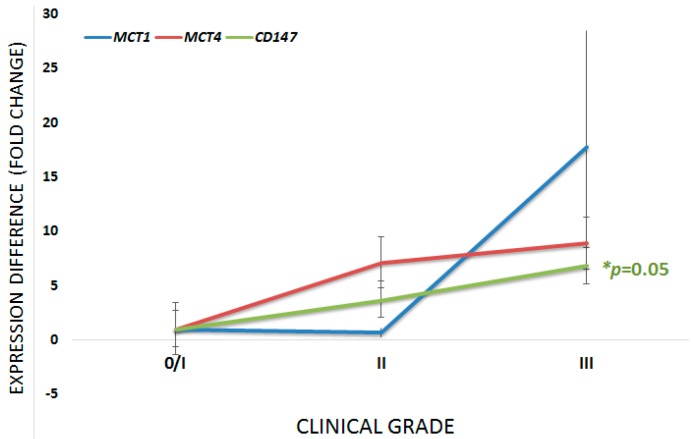
Figure 1.
Graphical representation of the difference in expression of the three markers under study according to the clinical stage. For all three cases, the smallest group of stage samples was used as the calibrator. * Kruskal–Wallis test; 95% confidence interval. p values are related to the CD147 curve.

