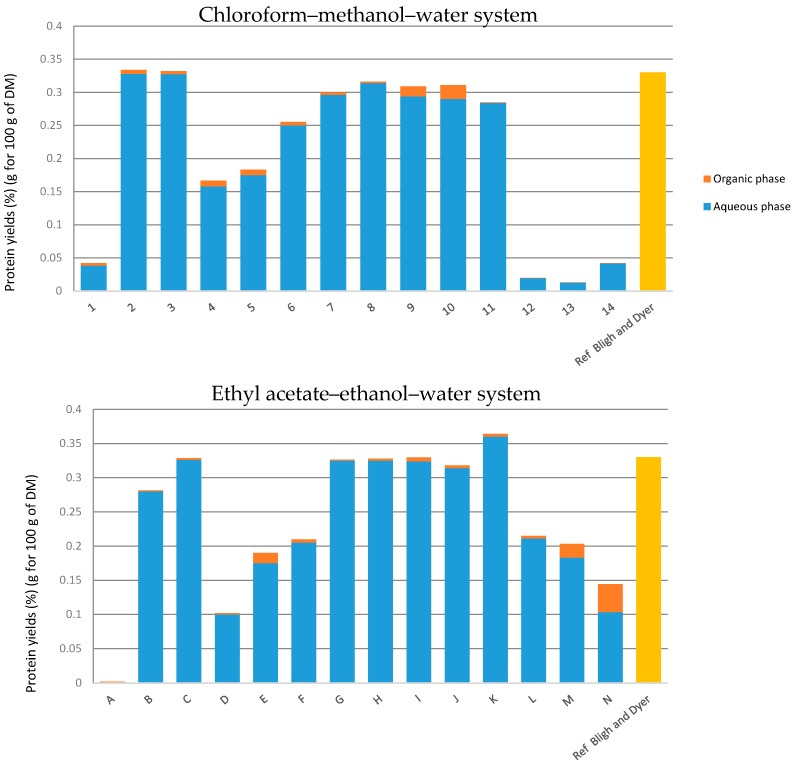
Figure 5.
Extraction yields of proteins in both systems. Yields obtained by UV spectrometry in aqueous and organic phases. Points 1 to 13 are in the diagram with the classical solvents and points A to N are in the diagram with the green alternative solvents. The orange part is the organic phase and the blue part is the aqueous phase.

