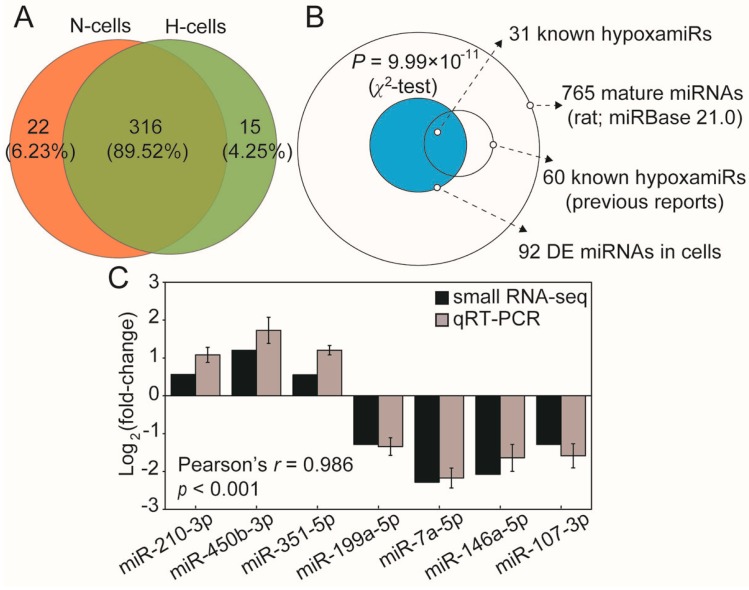
Figure 2.
miRNA expression profiles of normoxic and hypoxic H9c2 cells. (A) Venn diagram showing the numbers of overlapping and unique miRNAs detected in normoxic and hypoxic H9c2 cells; (B) Distribution of miRNAs. Out of 765 rat mature miRNAs deposited in miRBase 21.0, 60 (7.84%) miRNAs have been designated as hypoxamiRs based on the previous reports [7,10], and the hypoxamiRs (31 of 92, 33.69%) were overrepresented in the DE miRNAs of cells after hypoxia (blue circle); and (C) Seven miRNAs were randomly selected for qRT-PCR validation. “H” and “N” represented “Hypoxia” and “Normoxia”, respectively.

