Figure 3.
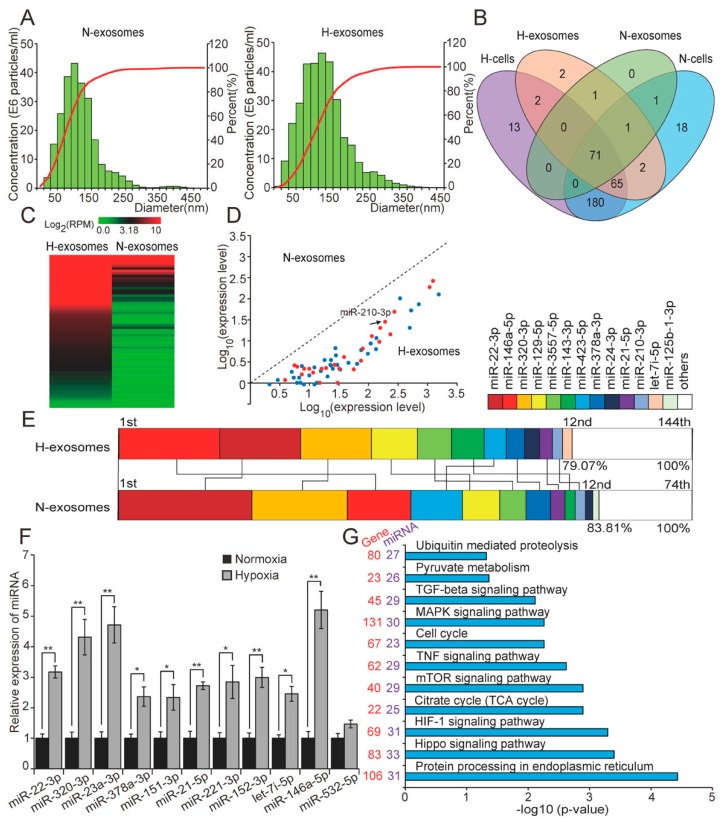
H9c2 cells-derived exosomal miRNAome was dramatically altered by hypoxia. (A) Particle size distribution in purified exosomes was measured by NanoSight Tracking Analyzer; (B) Venn diagram representing the numbers of miRNAs between H9c2 cells and exosomes before and after hypoxia; this revealed significant hypoxia-induced changes in the miRNAome of H9C2-derived exosomes; heatmap (C) and scatter diagram (D) showing the DE miRNAs (fold change <0.5 or >2 between hypoxia and normoxia) in exosomes; all of these DE miRNAs were upregulated in hypoxia compared with in normoxia; red dots represented known hypoxamiRs (arrow indicated miR-210-3p); (E) the 12 unique miRNAs with the highest expression levels in hypoxic and normoxic exosome miRNA libraries; this indicated that hypoxia significantly altered the ranking of the miRNAs within the list; (F) validation of small RNA-seq using qRT-PCR; and (G) gene ontology categories and pathways enriched for target genes of DE miRNAs in hypoxic exosomes. p-Values, which indicates the significance of the enrichment, were calculated by Benjamini-corrected modified Fisher’s exact test. “H” and “N” represented “Hypoxia” and “Normoxia”, respectively. All data are expressed as mean ± SD. * p < 0.05, ** p < 0.01.

