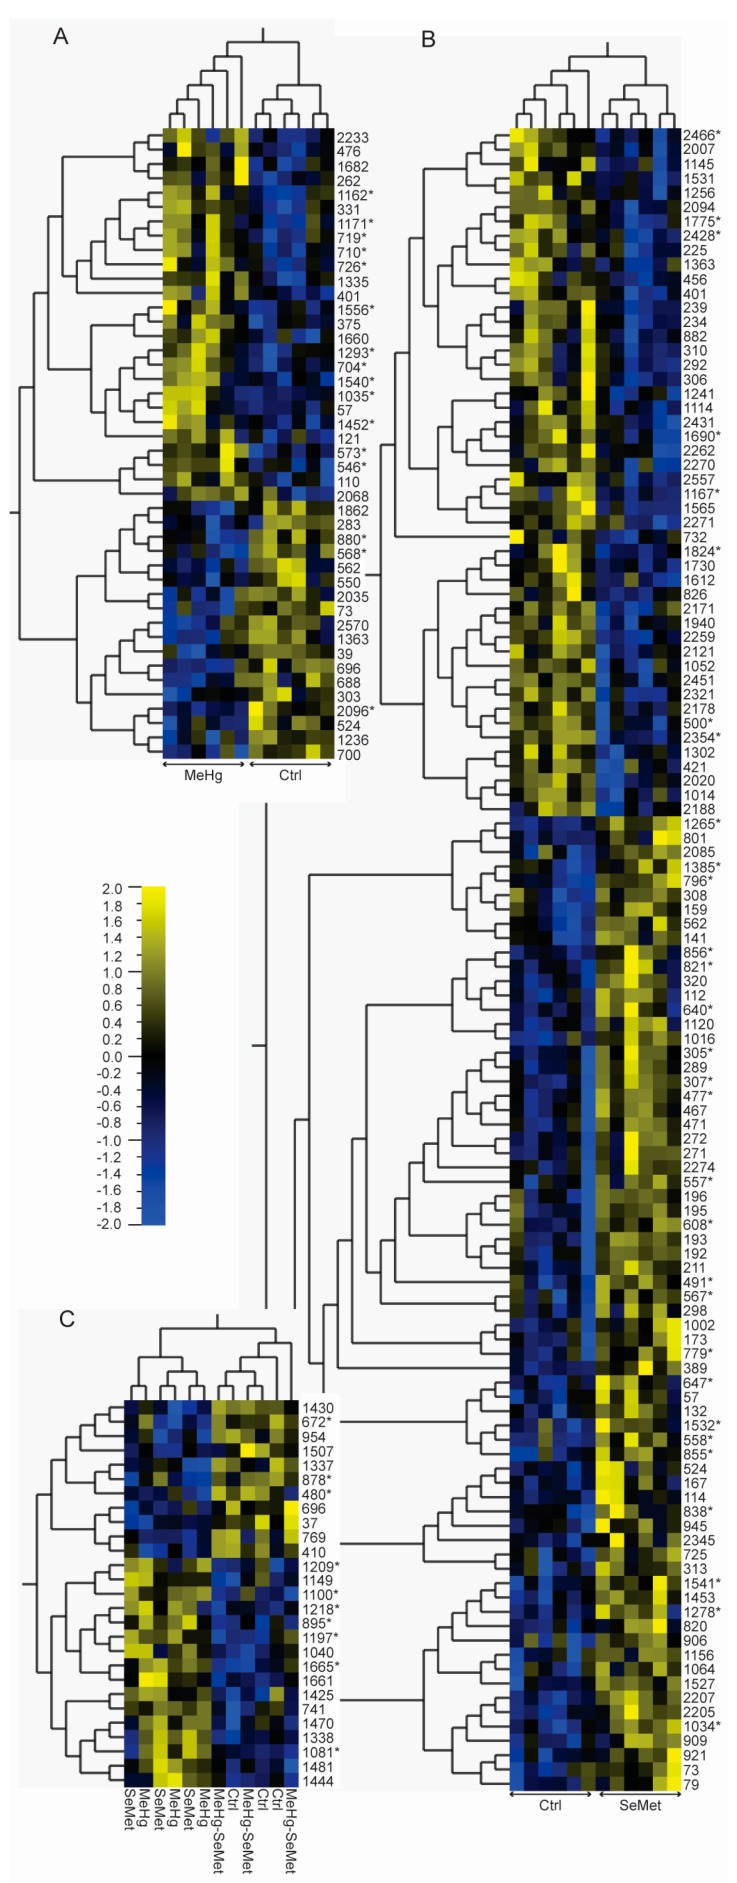
Figure 1.
Heatmaps of significantly regulated (p < 0.05, 2-way ANOVA) proteins in the brain of zebrafish (Danio rerio). Zebrafish were fed control, methylmercury (10 µg Hg/g; MeHg), selenomethionine (5 µg Se/g; SeMet), or MeHg and SeMet (10 µg Hg/g + 5 µg Se/g) supplemented diets. After eight weeks of exposure, the brains (n = 12) were sampled and subjected to quantitative intact proteomics analysis. Differential analysis (2-way ANOVA) and hierarchical clustering (Pearson correlation) were performed using the Qlucore omics-explorer. (A,B) depict significantly differentially expressed proteins after exposure to MeHg and SeMet, respectively (p < 0.05, 2-way ANOVA); (C) Depicts the proteins displaying significant MeHg-SeMet interaction effects. The numbers in plots describe the unique difference in gel protein spot identifiers. Protein spots successfully identified by LC-MS/MS are denoted with an asterisk (*). See Table S1 for further details on individual proteins.

